Category: In the News

pillows on a scale

Don’t “Weight” to Focus on a Good Night’s Sleep

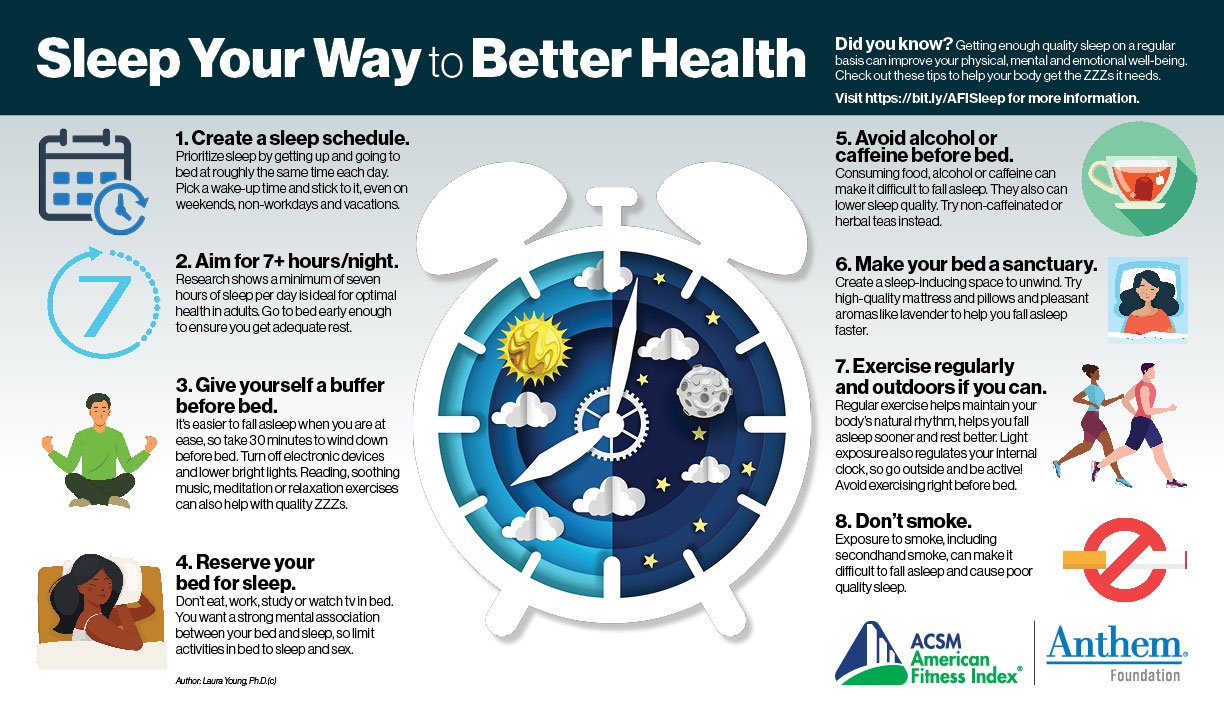
I am a poor sleeper. I am not the only one: The CDC reports one third of the U.S. population does not get the recommended amount of sleep. I recently decided to redouble my efforts to get more sleep. I am generally healthy, as I eat well and exercise regularly, so I primarily focused on improving my sleep hygiene (avoiding food/alcohol close to bedtime, consistent sleep times, relaxation techniques and a dark, cool room). For more severe sleep issues, talk to your doctor about other options, including pharmacotherapy, cognitive behavior therapy and non-invasive brain stimulation techniques (6).  

As I began to get more sleep, I noticed I was losing a few pounds. It wasn’t dramatic, but it was those couple extra pounds I had had a difficult time getting rid of. Especially with approximately 42% of the U.S. population now considered obese, I had to explore the relationship between sleep and body weight. 

It is well known that sleep is very important to our physical and mental health (more on the mental health side in next month’s blog). Sleep is not only measured in total sleep time (quantity), but also in quality (number of disturbances/awakenings, minutes awake after sleep onset and percent of time asleep). Ideal sleep amounts for adults are 7-9 hours (higher for children) with less than six awakenings, less than 30 minutes awake after sleep onset and 85% of time asleep (3). Between-day variability also plays a role, with increased variability contributing to lower-quality sleep. Sleep research varies in terms of measurement of sleep, ranging from self-report (e.g., Pittsburg Sleep Quality Index) to actigraphy or wearable device to the gold standard of a polysomnogram. Poor sleep increases the risk of chronic diseases and conditions such as cardiovascular disease, obesity, Type 2 diabetes, some cancers and depression, as well as poor performance in school, work, athletics and while driving. I discovered there is a reciprocal and complex relationship (and which varies by gender, age and race) between sleep quality/quantity and body weight.   

Insufficient sleep negatively impacts metabolism and is associated with increased body mass index (BMI), abdominal body fat and obesity. There are several mechanisms involved, including systemic inflammation, hormonal and metabolic changes and behavioral issues (11). Inflammation increases risk of cardiometabolic disease risk and hypertension, and decreases insulin sensitivity. Changes in the neuroendocrine system include increased ghrelin and orexin-A and decreased leptin, leading to increased appetite and hunger (9). With decreased sleep, there is a tendency towards increased energy intake due to associated behaviors such as increased secondary (not at mealtime) late-night eating and disinhibited (distracted) eating (4,13). These changes in sleep and food intake can also contribute to circadian misalignment, which further disrupts sleep (2). Increased daytime sleepiness may also decrease physical activity. We also see obesity (body weight gain) causing poor sleep due to comorbidities such as hypertension, pain, sleep apnea or exacerbated menopausal symptoms (1,12). 

There is also a positive bidirectional relationship between sleep and body weight change. Body weight loss is associated with improved sleep, and improved sleep is associated with body weight loss (10,14). Body weight loss often coincides with healthy behaviors such as increased physical activity and improved nutrition/eating patterns, which can contribute to improved sleep. Weight loss may also contribute to decreased pain, thus decreasing sleep disturbances. Better sleep health was associated with greater weight and fat loss with a weight-loss intervention (7). Optimizing sleep during a resistance training program provided body composition benefits of higher muscle mass and lower fat mass compared to resistance training alone (5).  

There is still much to learn about the complex connections between sleep and body weight, but this all sounds promising. As I approach the potential for weight gain associated with middle age and menopause, I will continue to include a healthy diet and varied physical activity — and you can bet I will be keeping sleep a priority.  


Author: Melissa W. Roti, Ph.D., FACSM

Professor, Director Exercise Science Program

Westfield State University, Westfield, Massachusetts

Twitter: @MelissaRoti 


References 

  1. Al-Safi ZA, Polotsky AJ. Obesity and menopause. 2015;29(4):548-53. 
  2. Barot N, Barot I. Nutrition and Sleep. In: Encyclopedia of Sleep. 2013. p. 108-13.  
  3. Berger AM et al. Sleep wake disturbances in people with cancer and their caregivers: state of the science Oncol Nurs Forum. 2005;32(6):E98-126. 
  4. Blumfield ML, Bei B, Zimberg IZ, Cain SW. Dietary disinhibition mediates the relationship between poor sleep quality and body weight. Appetite. 2018;120:602-8. 
  5. Jåbekk P, Jensen RM, Sandell MB, Haugen E, Katralen LM, Bjorvatn B. A randomized controlled pilot trial of sleep health education on body composition changes following 10 weeks’ resistance exercise. The Journal of Sports Medicine and Physical Fitness. 2020;60(5):743-8. 
  6. Jackowska M, Koenig J, Vasendova V, Jandackova VK. A two-week course of transcutaneous vagal nerve stimulation improves global sleep: Findings from a randomised trial in community-dwelling adults. Auton. Neurosci. 2022;240:102972. 
  7. Kline CE et al. The association between sleep health and weight change during a 12-month behavioral weight loss intervention. Int J Obes. 2021;45:639-49.  
  8. Leger D, Bayon V, Sanctis A. The role of sleep in the regulation of body weight. Molecular and Cellular Endocrinology. 2015;418(2):101-7. 
  9. Littman AJ et al. Sleep, ghrelin, leptin and changes in body weight during a 1-year moderate intensity physical activity intervention. International J Obesity. 2007;31:466-75. 
  10. O’Brien EM et al. Sleep duration and weight loss among overweight/obese women enrolled in a behavioral weight loss program. Nutrition & Diabetes 2:e43. 
  11. Schmid SM, Hallschmid M, Schultes B. The metabolic burden of sleep loss. The Lancet Diabetes & Endocrinology. 2015;3(1):52-62. 
  12. Shade MY, Berger AM, Dizona PJ, Pozehl BJ, Pullen CH. Sleep and health-related factors in overweight and obese rural women in a randomized controlled trial. J Behav Med. 2016;39:386-97. 
  13. Tajeu GS, Sen B. New pathways from short sleep to obesity? Associations between short sleep and “secondary” eating and drinking behavior. Amer J Health Promotion. 2017;31(3):181-8. 
  14. Thomson CA et al. Relationship between sleep quality and quantity and weight loss in women participating in a weight-loss intervention trial. Obesity. 2012;20:1419-25. 
blue clock on yellow background with "Z Z Z" in white

Should I Sleep or Exercise? The Relationship between Sleep and Activity

Daily sleep and physical activity each have individual impacts on a variety of health outcomes and risk factors (1,2,3). There may be reciprocal relationships between sleep and physical activity, but the extent of these relationships remains unclear. Common questions include: Does sleep duration affect physical activity intensity or duration? How much sleep loss can one tolerate and not affect physical activity? What is the best time of day to exercise? Given my time constraints, should I sleep or exercise? Researchers do not yet have all the answers to these questions, but the answer to the final question may simply be “both.” 

Sleep & Health 

Adequate sleep is necessary for all major physiological systems, including immune, endocrine and metabolic function (4,5,6). Meeting sleep guidelines (7-9 hours per night for most adults [6]) is consistently associated with beneficial physical health outcomes, including but not limited to, enhanced cognition, decreased risk for cardiovascular disease and Type 2 diabetes, and prevention of some types of cancer (5). Moreover, meeting sleep guidelines is associated with decreased psychological distress, anxiety and depression, longevity, and health-related quality of life (7). Of concern, data from the 2004-2017 National Health Information Survey and 2014 United States Behavioral Risk Factor Surveillance Survey suggest 30-35% of U.S. adults obtain less than the recommended seven hours of sleep per night (8,9). Moreover, an estimated 56% of U.S. adults live with sleep disorders, which is higher than similarly developed regions of the world (10). 

The negative impacts of sleep deprivation and sleep restriction on several health outcomes have been well documented (11,12). While many of us may not experience sleep deprivation (e.g., total loss of sleep) or chronic sleep restriction (e.g., partial nighttime sleep loss over multiple weeks, months or years), acute sleep restriction is a relatively common experience. Acute sleep restriction is commonly defined in experimental studies as a reduction in total sleep time to less than six hours of sleep per night over a single night or several nights. Obtaining less than six hours of sleep on just a single night impairs following-day cognition, including negative effects on memory (13,14), inhibitory control (15), executive function (13) and reaction time (14,16,17,18). 

Sleep & Physical Activity 

Similar to the health benefits associated with meeting sleep recommendations, meeting the 2018 ACSM Physical Activity Guidelines can reduce the risk of developing at least seven of the 10 most common chronic diseases in the United States (19). However, only 51% of American adults meet aerobic physical activity guidelines (20). Given the large portion of the population that does not meet sleep or physical activity guidelines, the next logical question to ask is “What are the relationships between these physical behaviors?” 

Most of the evidence exploring the reciprocal relationship between sleep and physical activity comes from cross-sectional and laboratory-based exercise studies (e.g., effect of sleep restriction on exercise performance). The results of cross-sectional studies are largely inconclusive, which is likely due to the wide range of subjective measurements used. Conversely, laboratory-based studies have more commonly demonstrated a negative impact of sleep restriction on subsequent exercise performance (21,22). Sleep restriction appears to be most detrimental for subsequent sub-maximal aerobic performance bouts lasting more than a couple of minutes. 

More recent research has attempted to extend these previous findings by experimentally altering sleep duration to better understand how one behavior affects another (e.g., how does a night of short sleep [3 hours] affect subsequent days of physical activity?). Some studies have demonstrated no effect of sleep restriction on light, moderate or vigorous physical activity (23,24), while others reported a reduction in physical activity (25,26,27). One comprehensive study explored the effects of two different types of sleep restriction (delayed-onset sleep restriction [going to bed in the middle of the night] and early awakening sleep restriction [waking up in the middle of the night]) on accelerometer-derived physical activity compared to a normal night of sleep in healthy adult men (26). Interestingly, the results indicated a significant reduction in total physical activity only under the early awakening sleep restriction condition, which was driven by reduced vigorous-intensity physical activity. These data suggest that the timing of sleep restriction, as well as physical activity intensity, are important considerations when understanding the relationships between these physical behaviors. 

While there are clear benefits to meeting individual sleep and physical activity guidelines, several questions about the relationships between these physical behaviors remain. A better understanding of the complex relationships between sleep, physical activity and sedentary behaviors will provide clinicians and health professionals with tools to better council patients from a holistic health perspective. 

Authors: John D. Chase, M.S., and John R. Sirard, Ph.D. 

References 

  1. Dzierzewski JM, Buman MP, Giacobbi PR, Roberts BL, Aiken-Morgan AT, Marsiske M, McCrae CS. Exercise and sleep in community-dwelling older adults: Evidence for a reciprocal relationship. J Sleep Res. 2014;23:61-68. doi:10.1111/jsr.12078.
  2. Chennaoui M, Arnal PJ, Sauvet F, Léger D. Sleep and exercise: A reciprocal issue? Sleep Med Rev. 2015;20:59-72. doi:10.1016/j.smrv.2014.06.008.
  3. Mead MP, Baron K, Sorby M, Irish LA. Daily associations between sleep and physical activity. Int J Behav Med. 2019;26:562-8. doi:10.1007/s12529-019-09810-6.
  4. Santos RVT, Tufik S, De Mello MT. Exercise, sleep and cytokines: Is there a relation? Sleep Med Rev. 2007;11:231-9. doi:10.1016/j.smrv.2007.03.003.
  5. Watson NF et al. Joint consensus statement of the american Academy of Sleep Medicine and Sleep Research Society on the recommended amount of sleep for a healthy adult: Methodology and discussion consensus. Sleep. 2015;38:1161-83.
  6. Hirshkowitz M et al. National Sleep Foundation’s sleep time duration recommendations: Methodology and results summary. Sleep Heal. 2015;1:40-43. doi:10.1016/j.sleh.2014.12.010.
  7. Loprinzi PD, Joyner C. Meeting sleep guidelines is associated with better health-related quality of life and reduced premature all-cause mortality risk. Am J Heal Promot. 2018;32;68-71. doi:10.1177/0890117116687459.
  8. Sheehan CM, Frochen SE, Walsemann KM, Ailshire JA. Are U.S. adults reporting less sleep? Findings from sleep duration trends in the National Health Interview Survey, 2004-2017. Sleep. 2019;42:1-8. doi:10.1093/sleep/zsy221.
  9. Liu Y, Wheaton AG, Chapman DP, Cunningham TJ, Lu H, Croft JB. Prevalence of healthy sleep duration among adults – United States, 2014. CDC Morb Mortal Wkly Rep. 2016;65:137-41. doi:10.15585/mmwr.mm6506a1.
  10. Léger D, Poursain B, Neubauer D, Uchiyama M. An international survey of sleeping problems in the general population. Curr Med Res Opin. 2008;24:307-17. doi:10.1185/030079907X253771.
  11. Banks S, Dinges DF. Behavioral and physiological consequences of sleep restriction. J Clin Sleep Med. 2007;3:519-28. doi:10.1055/s-0029-1237117.
  12. Vgontzas AN, Zoumakis E, Bixler EO, Lin H, Follett H, Kales A, Chrousos GP. Adverse effects of modest sleep restriction on sleepiness, performance, and inflammatory cytokines. J Clin Endocrinol Metab. 2004;89:2119-26. doi:10.1210/jc.2003-031562.
  13. Lo JC, Ong JL, Leong RLF, Gooley JJ, Chee MWL. Cognitive performance, sleepiness, and mood in partially sleep deprived adolescents: The need for sleep study. Sleep. 2016;39:687-98. doi:10.5665/sleep.5552.
  14. Alhola P, Polo-Kantola P. Sleep deprivation: Impact on cognitive performance. Neuropsychiatr Dis Treat. 2007;3:553-67. doi:10.1016/j.smrv.2012.06.007.
  15. Fallone G, Acebo C, Arnedt TA, Seifer R, Carskadon MA. Effects of acute sleep restriction on behavior, sustained attention, and response inhibition in children. Percept Mot Skills. 2001;93:213-29.
  16. Rossa KR, Smith SS, Allan AC, Sullivan KA. The effects of sleep restriction on executive inhibitory control and affect in young adults. J Adolesc Heal. 2014;55:287-92. doi:10.1016/j.jadohealth.2013.12.034.
  17. Van Dongen H, Maislin G, Mullington J, Dinges D. The cumulative cost of additional wakefulness: Dose-response effects on neurobehavioral functions and sleep physiology from chronic sleep restriction and total sleep deprivation. Sleep. 2003;26:117-26. doi:10.1001/archsurg.2011.121.
  18. Taheri M, Arabameri E. The effect of sleep deprivation on choice Reaction time and anaerobic power of college student athletes. Asian J Sports Med. 2012;3:15-20.
  19. Ward BW, Schiller JS, Goodman RA. Multiple chronic conditions among us adults: A 2012 update. Prev Chronic Dis. 2014;11:4-7. doi:10.5888/pcd11.130389.
  20. Schiller JS, Lucas JW, Peregoy JA. Summary health statistics for U.S. population: National health interview survey, 2011. National Center for Health Statistics. Vital Heal Stat. 2012;10:1-218.
  21. Fullagar HK, Skorski S, Duffield R, Hammes D, Coutts AJ. Sleep and athletic performance: The effects of sleep loss on exercise performance, and physiological and cognitive responses to exercise. Sport Med. 2014:1-26. doi:10.1007/s40279-014-0260-0.
  22. Chase JD, Roberson PA, Saunders MJ, Hargens TA, Womack CJ, Luden ND. One night of sleep restriction following heavy exercise impairs 3-km cycling time-trial performance in the morning. Appl Physiol Nutr Metab. 2017:42. doi:10.1139/apnm-2016-0698.
  23. Romney L, Larson MJ, Clark T, Tucker LA, Bailey BW, LeCheminant JD. Reduced sleep acutely influences sedentary behavior and mood but not total energy intake in normal-weight and obese women. Behav Sleep Med. 2016;14:528-38. doi:10.1080/15402002.2015.1036272.
  24. Brondel L, Romer MA, Nougues PM, Touyarou P, Davenne D. Acute partial sleep deprivation increases food intake in healthy men. Am J Clin Nutr. 2010;91:155-9. doi:10.3945/ajcn.2009.28523.
  25. Schmid SM, Hallschmid M, Jauch-Chara K, Wilms B, Benedict C, Lehnert H, Born J, Schultes B. Short-term sleep loss decreases physical activity under free-living conditions but does not increase food intake under time-deprived laboratory conditions in healthy men. Am J Clin Nutr. 2009;90:1476-82. doi:10.3945/ajcn.2009.27984.
  26. Wilms B, Kuhr M, Chamorro R, Klinsmann N, Spyra D, Mölle M, Kalscheuer H, Schultes B, Lehnert H, Schmid SM. Chronobiological aspects of sleep restriction modulate subsequent spontaneous physical activity. Physiol Behav. 2020;215:112795. doi:10.1016/j.physbeh.2019.112795.
  27. Bromley LE, Booth JN, Kilkus JM, Imperial JG, Penev PD. Sleep restriction decreases the physical activity of adults at risk for type 2 diabetes. Sleep. 2012;35:977-84. doi:10.5665/sleep.1964.


teen boy walking with a backpack

Physical Activity, Healthy Weight, and National Security

When Sports Illustrated subscribers thumbed through the final issue of 1960, they encountered the usual assortment of sporting news. Bart Starr led the Packers past the Rams at Los Angeles Memorial Coliseum. The Indiana men’s basketball team continued their winning ways, breezing by Missouri and Nevada on the shoulders of Walt Bellamy. But the sportswriters were overshadowed by someone more famous, the President-elect of the United States.

In “The Soft American,” an op-ed as provocative as its title, John F. Kennedy railed against the declining physical fitness of the American people. He warned that vehicle-focused transportation and television-focused recreation were displacing the active pursuits of an earlier age. After championing the link between physical activity and mental health, he wrote that “physical fitness is as vital to the activities of peace as to those of war.” But Kennedy’s primary focus was national security: our nation must be physically prepared to meet the demands of armed conflict.

Six decades on, how are we doing?

To investigate how the nation is doing 60 years later, we partnered with American College of Sports Medicine members who have expertise in military medicine. We used data collected from January 2015 through March 2020 by the National Health and Nutrition Examination Survey (NHANES) to assess the physical preparedness of the US civilian population. NHANES provides information about the health of Americans through a combination of personal interviews and direct physical examination.

We found that only 47% of the military-aged population (17–42 years) had a body mass index (BMI) within the eligible range for military entrance (19.0–27.5 kg/m2). Unlike previous studies of physical preparedness, we did not limit the investigation to height and weight, because an eligible BMI does not guarantee a person will be ready for the physical demands of initial military training. Lower amounts of physical activity before training are associated with higher rates of musculoskeletal injury during training and medical discharge from training. These are costly outlays—to the individual and to the armed forces.

Therefore, we also determined the proportion of people getting adequate physical activity in the military-aged population. We defined adequate physical activity as reporting the equivalent of at least 300 minutes per week of moderate-intensity aerobic physical activity. (This corresponds to the “highly active” category of the Physical Activity Guidelines for Americans, 2nd edition, and is similar to the US Army recommendations for physical activity before entering initial military training.) Using this definition, we found that 28% of the BMI-eligible population were not adequately physically active.

Taken together, only 34% of people aged 17–42 years were both weight-eligible and adequately physically active—what we termed “eligible and active.” Among those aged 17–24 years, who account for the majority of military applicants, the proportion of eligible and active was marginally higher at 41%. In other words, according to our definitions, just two in five young Americans were physically prepared for the rigors of initial military training. Further, we found disparities in the proportion eligible and active by sex, race/ethnicity, educational attainment, and family income level.

What can be done?

In the Centers for Disease Control and Prevention’s (CDC) Division of Nutrition, Physical Activity, and Obesity, we are working with partners to create a more active America. Active People, Healthy NationSM, CDC’s national physical activity initiative, aims to help 27 million Americans become more active by 2027. The initiative promotes seven evidence-based strategies to increase physical activity. Providing equitable and inclusive access is foundational to each strategy.

Everyone can be involved. From education to transportation to parks and recreation, we have tools and resources available to help people in different sectors take action to encourage physical activity. For example, people working in the education sector could develop activity-friendly policies that facilitate student physical activity before, during, and after school. Considering that most military enlistees in 2030 are currently in elementary or middle school, these policies have the potential for near-term ripple effects on military recruitment.

One strategy we support is building activity-friendly routes to everyday destinations. This strategy focuses on creating sidewalks, bicycle lanes, and paths that connect to common places such as parks, shops, grocery stores, and houses of worship. Activity-friendly communities have many benefits. They promote cleaner environments and stronger local economies. And they support healthier Americans—some of whom will volunteer to serve as our nation’s next generation of soldiers, sailors, marines, airmen, and guardians.

Three weeks before assuming the presidency, JFK sized up the nation’s physical fitness and found it wanting. Get active, he urged. Expand participation in youth sports, promote walking and bicycling to school, encourage the pursuit of a vigorous life. Despite progress in some areas and regression in others, his diagnosis and prescription endure. If you agree that physical inactivity remains “a matter of urgent concern,” consider staying connected with us through Active People, Healthy NationSM.

Additional Resources

Disclaimer: The findings and conclusions in this blogpost are those of the authors and do not necessarily represent the official position of the Centers for Disease Control and Prevention, the US Air Force, the US Department of Defense, or the US government.


Authors:

Bryant Webber, MD, MPH (Lt Col, USAF, MC), Physical Activity and Health Branch, Division of Nutrition, Physical Activity, and Obesity, Centers for Disease Control and Prevention

Kaitlin Graff, MSW, MPH, Program Coordinator, McKing Consulting Corporation/Physical Activity and Health Branch, Division of Nutrition, Physical Activity and Obesity, Centers for Disease Control and Prevention

Geoffrey Whitfield, PhD, MEd, Physical Activity and Health Branch, Division of Nutrition, Physical Activity, and Obesity, Centers for Disease Control and Prevention

Facebook: CDC Eat Well Be Active

Twitter: @CDC_DNPAO

#activepeople 

Physical Activity in School-Aged Children

School-aged children should get at least 60 minutes of moderate- or vigorous-intensity physical activity every day of the week. Only 26% of adolescents met these physical activity guidelines in 2018, and that percentage has remained stable since 2011. 

The COVID-19 pandemic made it even more difficult for children to meet these guidelines. At the start of the pandemic, my son switched to online school, and the community park was blocked off with bright-yellow caution tape. Despite knowing the risk of sedentary behavior and decreased physical activity, we found our kids were less likely to engage in free play without friends, parks and school. 

The rate of increase in body mass index (BMI) in children 2-19 years of age nearly doubled during the COVID-19 pandemic compared to pre-pandemic rates. This faster increase in BMI was most pronounced in children who were already overweight, and in younger school-aged children. The number of children and teens classified as obese increased from 19% pre-pandemic to 22% at the time of publication. 

The COVID-19 pandemic shut down schools, sports, after-school programs and community parks. In addition to disruptions in physical activity opportunities, there was also loss of income, increased food insecurity, increased stress and increased screen time. Despite the return of school and community-based programs, sports participation has not rebounded back to pre-pandemic levels. BMI changes during the COVID-19 pandemic highlight the importance schools play in the health of our children and the community. 

Activity Guidelines for School-Age Children InfographicPhysically active children have lower rates of obesity in childhood, and a lower risk of obesity and chronic medical conditions in adulthood. In addition, higher levels of physical activity improve cognition, executive function, attention and academic performance. Increasing physical activity in schools through daily recess, physically active classroom lessons, longer or more frequent physical education classes and before- and after-school activities helps children reach physical activity guidelines and build the foundation of a healthy lifestyle into adulthood 

Fortunately, 93 of the 100 largest U.S. cities (listed in the ACSM American Fitness Index®) are located in states that require physical education* in elementary, middle and high school. This ensures millions of children learn how to be physically active for a lifetime. Families should also be encouraged to stay active as a family, provide opportunities for free play, participate in active transportation and limit screen time. My kids were happier, slept better and were more engaged when the parks opened back up, they went back to school and they had much less computer time. 

The extra time needed to increase physical activity both in school and after school is easily made up for with improved concentration, attention span and academic performance. Utilizing school-based physical activity programs has never been more important!

Download the infographic. 

Author: Jessie Fudge, M.D., FACSM, Kaiser Permanente Washington 

*The Fitness Index’s physical education indicator is based on state-level policies requiring a minimum amount of physical education for all schools in the state. Policies are coded 0-3 depending on the amount of physical education required. States requiring physical education at all three grade levels (elementary, middle, and high school) are given the highest score. Two states represented in the Fitness Index were coded zero for having no state policy requiring physical education: Colorado and Hawaii. 

The Cost of Mental Health: Seeking Community Solutions

Good mental health is effective functioning in daily activities resulting in good productivity (e.g., work, school), healthy relationships and the ability to cope with adversity. A threat to good mental health is mental illnesses, which are health conditions involving changes in emotion, thinking or behavior (or a combination of these). Those experiencing mental illness may have difficulties functioning in social, work or family activities. Millions of Americans are affected by mental illness each year. Approximately one in five (20%) U.S. adults experience mental illness each year, with one in 20 experiencing a severe mental illness yearly. The great news is that mental illness is treatable, with most people continuing to function in their daily lives despite their mental illness.

Of the millions of U.S. adults experiencing mental illness in 2020, only 46% received treatment, leaving millions to deal with their mental diseases alone. Those dealing with depression have a 40% higher risk of developing cardiovascular and metabolic disease than the general population. People with serious mental health illnesses are twice as likely to develop these same health complications. On the community level, it is estimated that almost 21% of the people experiencing homelessness have at least one serious mental health condition. And of those incarcerated, approximately 37% have a diagnosed mental illness. Untreated mental illnesses have a devastating impact on a person’s physical health and economic health, as serious mental illness accounts for $193.2 billion in lost earnings every year. With so much at stake, the solution appears to be simple—increase the percentage of people receiving mental health treatment.

Unfortunately, of the almost 330 million people living in the U.S., 148 million (45%) live in a designated Mental Health Professional Shortage Area, placing these individuals at considerably higher risk of experiencing the ripple effects of mental illness. With so many not having ready access to mental health services, community mental health centers are critical to meeting the demand for mental health treatment. Community mental health centers are community-based and provide mental services, often as an alternative to hospitals. These community centers are mainly funded by federal, state and county programs. Local governments, which allocate funds to various programs on their level, are often forced to decide where the limited funds are given. Community mental health centers need to be prioritized for funding, considering the effects of poor mental health on the individual and community.

In addition to the mental health professional shortage areas, there is a shortage of providers. The lack of providers has caused many people not to be able to receive treatment, even when proactively seeking it out. Many adults will simultaneously experience a substance use disorder with mental illness, often as a coping mechanism. The shortages of mental health professionals have resulted in inadequate access to treatment, at an alarming rate of 11% of individuals in need of substance abuse treatment receiving treatment. Mental health professionals commonly found in community health centers include social workers, psychiatrists, counselors, psychologists and peer support specialists. With funding shortages, community centers cannot hire professionals that can be of service to the community member. Some community centers also serve as assertive community treatment centers, where they provide services for mental health and offer housing assistance, financial management and employment services for the community members.

In 2014, the Protecting Access to Medicare Act of 2014 created the concept of certified community behavioral health clinics, which provide comprehensive mental health and substance use services to individuals, often at no cost. In 2021, new federal funding aimed to expand the number of certified community behavioral health clinics to 340. Local officials should encourage the community centers in their areas to adjust to meet the guidelines set forth to establish themselves as a certified community behavioral health clinic. With funding a constant issue for local municipalities, any investment in community mental health centers can also be cost-saving for other more expensive programs.

Author:  Alvin L. Morton III, M.S., Doctoral Candidate, University of Tennessee at Knoxville

fresh produce with the fitness index logo

Food Insecurity: Defining and Addressing a Community Health Challenge

Food insecurity is defined by the U.S. Department of Agriculture (USDA) as   “a household-level economic and social condition of limited or uncertain access to adequate food.”  Generally, this indicator refers to households who don’t have enough food, particularly healthy food, to eat due to a lack of money and other resources. There are slight variations in how different organizations define food insecurity, but all relate to households who lack healthy food.   

How big is the problem? 

During the  COVID-19 pandemic, a spotlight was focused on food insecurity as many individuals lost their jobs, schools closed resulting in children not getting meals there and other normal sources of food were curtailed, resulting in households being unable to obtain all of the food that they needed. The U.S. Census Pulse Survey results indicate that those who sometimes or often did not have enough to eat due to lack of resources increased from about 20% pre-pandemic to 28% by mid-2021.  

10 US cities with lowest rates of food insecurity in 2021

The Feeding America non-profit group produces annual “Map the Meal Gap” reports that include estimates of food insecurity at the city level.  Their most recent report (2020) was used as the measure of food insecurity in the 2021 American Fitness Index (Fitness Index). Feeding America uses U.S. Census Current Population Survey data to measure of food insecurity based on a well-established statistical model using unemployment rates, median incomes, racial demographics and other factors shown to be determinants of food insecurity. Across the 100 cities included in the 2021 Fitness Index, there was almost a three-fold difference in the percentage of households with food insecurity, from a low of 6.7% for Arlington, VA, to a high of 18.2% for St. Louis, MO.  

What is the impact of food insecurity? 

A considerable amount of research  has examined the physical and mental impact of food insecurity, including poor physical health outcomes, inadequate intake of key nutrients for optimum functioning and increased risk of chronic disease. Associations also exist between food insecurity and obesity along with poor glycemic control among those with diabetes. Of particular concern from a fitness perspective is that food insecure households may not consume an adequate amount of protein, a nutrient essential for a variety of bodily functions, including building and repairing muscles,  bone health and development and stabilizing blood sugar.  

Healthy cognitive,  psychological and emotional development among children is also dependent on them consuming sufficient amounts of nutritious food. America’s poor and near-poor children are at higher risk of lower academic achievement and behavioral problems. Food insecurity has been associated with poor psychological and cognitive functioning, higher probability of behavioral problems and higher levels of aggression and anxiety among children. Food insecure women are more likely to experience prenatal depressive symptoms than food secure women. Another consequence of food insecurity is poor sleep which can cloud thinking and lower energy, as well as decrease the ability to make good decisions. The profound impact of food insecurity on individuals’ physical and mental health made a clear case for adding this indicator to the Fitness Index.  

How is food insecurity addressed at a policy level? 

The federal government  recently expanded the Supplemental Nutrition Assistance Program (SNAP), Women, Infants and Children (WIC) and other safety net programs that support low-income children and mothers during the pandemic to help increase access to food among those in need. These programs provide more than half of all food support for households in need. The USDA has also funded innovative demonstration projects such as creating and distributing meal boxes that contain a week’s worth of groceries that can be delivered to those in need. 

What can city officials do to reduce food insecurity  locally?  

In addition to supporting existing food banks, pantries and other food providing programs, many city  officials have supported the development and maintenance of innovative and effective programs to improve access to healthy food. The following examples offer city officials, local businesses and residents an opportunity to get involved in reducing food insecurity in their communities. 

  • Organize food providing programs into a network that shares  information and resources as well as analyzes food need patterns to build capacity in advance of expected needs.  
  • Develop apps or websites  to make local food resource information readily available. Information about food access is a critical resource particularly for households newly in need. 
  • Establish mobile food pantries and farm produce trucks to carry needed food into the food deserts and to others in need of food.  
  • Partner with  farm-to-table and farm-to-school programs which are effective ways to ensure those in need have access to fresh produce while at the same time supporting local farmers.  
  • Start  community gardens, using city property when allowed, as public gardening spaces. Those interested are assigned an area in a shared garden where they can grow fresh fruits and vegetables. Seeds, water, tools and other resources are often provided or shared when available.  
  • Create a  food rescue program that gathers unused food from restaurants and similar food preparation organizations that might have otherwise been discarded, and distribute these food items to agencies that provide hot meals to those in need. Alternatively, food rescue programs can work with local farmers to glean what is left in farmers’ fields after their harvest. This rescues fresh fruits and vegetables that would otherwise go to waste in fields. 
  • Support organizations that help those in need understand their eligibility for benefits and help them navigate the application process. State agencies are responsible for distributing  SNAP and WIC benefits, but many eligible people are not enrolled because applying for these benefits can be cumbersome and confusing.  

While the problem is  large, there is much we can all do to reduce food insecurity across the country. Clearly, having access to healthy food is important in all cities, and innovative, effective programs can be used by city officials to improve the access.  

If you or someone you know is experiencing food insecurity, you can find help at  www.feedingamerica.org/need-help-find-food.  


Author: Terrell W. Zollinger, DrPH, Professor Emeritus, Indiana University 

man sleeping in blue blankets and a pillow

The Importance of Sleep for Health

When we think about the most important actions that we can take to protect our health, we usually consider behaviors such as partaking in regular physical activity or eating a nutritious diet. Yet, an often-overlooked aspect of maintaining a healthy lifestyle is sleep. Sleep has serious implications for your physical and mental health. Adequate sleep will help you recover from exercise, enable your immune system to fight off pathogens and increase cognitive performance. In fact, to highlight its importance to health, the number of hours that people sleep is included as an indicator in the annual ACSM American Fitness Index (Fitness Index).

Despite the proven benefits of sleep on overall health, many of us tend to view it as a luxury and fail to get enough sleep. In fact, the Fitness Index reports that less than 65% of those who live in America’s 100 biggest cities get enough sleep (this number improves only modestly to 70% when we look at the entire U.S. population). Chronic sleep deprivation can have serious consequences on your health. For example, data have shown that lack of sleep can impair your body’s insulin response1—which can potentially contribute to the onset of diabetes. Moreover, chronic sleep deprivation has been associated with an increased risk of obesity and cardiovascular disease2. Lack of sleep can also alter memory retention, cause a negative mood, and inhibit your capacity to operate a motor vehicle. Data show that sleep deprivation impairs your ability to function to a greater extent than if you were intoxicated3.

Considering the negative ramifications of sleep deprivation, it is important to develop good sleep hygiene that contributes to a healthy lifestyle. To accomplish this goal, we must first commit to making sleep a priority. This sounds pretty intuitive but can also be difficult to do if you are juggling several responsibilities. To find balance, try building your daily schedule around your sleep (in much the same way you schedule other important activities like doing regular exercise or eating). Remember, if you make something a priority, you will always find time for it! Another way of developing good sleep hygiene is to go to sleep and wake up at roughly the same time every day, regardless of whether it is a weekend or vacation day. Doing this will help you fall asleep faster and make sleep less stressful.

Another key trait in those who have great sleep hygiene is having a pre-sleep ritual. Developing a routine that you can implement at least thirty minutes before going to bed will help “tell” your body it is time to go to sleep. Adopt activities that will help you relax, such as, taking a hot shower, reading a book or reducing your screen time. The bright light emitted from screens can alter how our bodies release melatonin and adenosine, two key chemicals that initiate our sleep cycles. In turn, it is best to just avoid looking at screens altogether before you go to bed. Lastly, do your best to make your bed your sleep sanctuary. Obviously depending on your circumstances, this may not be possible, but definitely try to use your bed for nothing other than sleep. You can make your space more conducive to promoting sleep by limiting the amount of light that enters your room and setting the room to a cooler temperature. Making these adjustments will contribute to a more restful night of sleep and help you build a sustainable habit.


Sources:

  1. Knutson, K. L., Ryden, A. M., Mander, B. A., & Van Cauter, E. (2006). Role of sleep duration and quality in the risk and severity of type 2 diabetes mellitus. Archives of internal medicine166(16), 1768–1774. https://doi.org/10.1001/archinte.166.16.1768
  2. Pacheco, D. (2021, June 24). Physical health and sleep: How are they connected? Sleep Foundation. https://www.sleepfoundation.org/physical-health.
  3. Williamson, A. M., & Feyer, A. M. (2000). Moderate sleep deprivation produces impairments in cognitive and motor performance equivalent to legally prescribed levels of alcohol intoxication. Occupational and environmental medicine, 57(10), 649–655. https://doi.org/10.1136/oem.57.10.649


Authors: Rafael Alamilla, M.S. and NiCole Keith, Ph.D. Ph.D., FACSM, IUPUI, Indiana University, Regenstrief Institute, Inc.


Infographic Sources:

  1. Markwald, Rachel R. Ph.D.; Iftikhar, Imran M.D., FACP, FCCP; Youngstedt, Shawn D. Ph.D. BEHAVIORAL STRATEGIES, INCLUDING
    EXERCISE, FOR ADDRESSING INSOMNIA, ACSM’s Health & Fitness Journal: March/April 2018 – Volume 22 – Issue 2 – p 23-29
  2. Bushman, Barbara A. Ph.D., FACSM Exercise and Sleep, ACSM’s Health & Fitness Journal: September/October 2013 – Volume 17 – Issue 5
    – p 5-8
  3. Pujalte, George G.A. MD, FACSM1; Benjamin, Holly J. MD, FACSM2 Sleep and the Athlete, Current Sports Medicine Reports: April 2018 –
    Volume 17 – Issue 4 – p 109-110
  4. American Academy of Sleep Medicine Public Safety Committee. TIP SHEET FOR HEALTH CARE PROVIDERS:
    Prioritizing Sleep & Managing Fatigue, 2021.

Infographic Author: Laura Young, Ph.D.

group of people doing tai chi in the park

Active People, Healthy Nation℠: Creating an Active America Together

Regular physical activity is one of the most important things that people can do to support their  health.  Being active can immediately help people feel better after each session of activity, and regular physical activity can reduce the risk of many chronic diseases and premature death. 

Although the benefits  of physical activity are well known,  many people  do not engage in the recommended amount of physical activity.  Populations with low income compared with higher incomes,  people  who are Black or Hispanic compared to non-Hispanic White  people  and residents of rural  areas  compared to urban areas have lower rates of physical activity.  We know that systematic inequities exist in opportunities to be physically active  which contribute to these  disparities.   

In response to  the  low  levels of physical  activity in the United States and the numerous benefits of being physically active,  in January 2020,  the Centers for Disease Control and Prevention launched  Active People, Healthy Nation,  a nationwide effort that aims to help 27 million Americans become more physically active by 2027.  The initiative supports equitable and inclusive access to opportunities for physical activity for all people regardless of age, race, education, socioeconomic status, disability status, sexual orientation or geographic location. 

How  do we increase  levels of physical  activity in the United States? 

sign post with seven arrows alternating pointing left and rightActive People, Healthy Nation provides a comprehensive  evidence-based  approach to improving physical activity by  promoting   at  the local, tribal, state and national level s even strategies that work  in partnership with other federal agencies and national organizations  (see figure).  Every Active People, Healthy Nation strategy can be designed to support equitable and inclusive access to opportunities for physical activity.  Communities can select strategies to increase physical activity that fit with their local context, including the needs and preferences of community members and community assets. 

How do I get involved? 

Everyone has a role to play  to increase physical activity—individuals, organizations and community champions. By joining Active People, Healthy Nation, you  and/or your organization  become part of a nationwide initiative and can help increase physical activity in the United States, reduce healthcare costs, build walkable neighborhoods, support local economies,  address health equity  and improve health for individuals, families and your communities. 

Joining is easy!  Visit the Active People, Healthy Nation  join  webpage  and click on the appropriate category: Individual Influencers, Organizations, or Community Champions.  Enter your email address to become  a supporter. There are a number of benefits including: 

  • Receiving access to resources and information through a monthly Active People, Healthy Nation newsletter. 
  • Receiving  website badges, social media messages and other resources to help spread the word about your work and your support for the initiative. 
  • Connecting  to a network of individuals, organizations and champions supporting Active People, Healthy Nation at national, tribal, state, and local levels. 

What can I do? 

Supporters have been  taking action  to support Active People, Healthy Nation and you can too!  Here are a few examples  of what other supporters have done and ways you can get involved: 

  • Individual influencers, organizations and champions have been posting on social media using #ActivePepole. Learn more about ways you can spread the word  
  • The  Maricopa Association of Governments  passed the first Active People, Healthy Nation Proclamation, showing commitment to active transportation and increasing physical activity in their community.  You can download  the  proclamation template  and work with an elected official to pass one in your community!  
  • The Division of Nutrition, Physical Activity, and Obesity within CDC currently  funds 61 recipients  in states and communities across the country to  create activity-friendly routes to  everyday  destinations,  based on  an evidence-based  strategy to increase physical activity recommended by the U.S. Community Preventive Services Task Force.  Projects  vary across communities and can include connecting routes like  sidewalks, paths, bicycle routes  and  public transit with destinations, such as  homes, early care and education, schools, worksites, parks  or  recreation centers. See if there is a  funded community  where you live and get involved! 
  • The Physical Activity Policy Research and Evaluation Network (PAPREN) is a CDC-funded Network that brings diverse partners together to create environments that maximize physical activity. PAPREN is a key research partner of CDC’s Active People, Healthy Nation initiative, facilitating collaboration across sectors and providing evidence and tools that states and communities can use to implement policy approaches to promote physical activity. Learn more about PAPREN  at-a-glance  or visit the PAPREN website  to join this  network of researchers, planners, engineers, policy makers, green space managers, health professionals, physical activity and fitness professionals and others. 

How can the  American Fitness Index  be used in conjunction with Active People, Healthy Nation? 

Tools such as the American Fitness  Index  provide data that decision makers  and partners  can use when creating plans  to improve physical activity in their communitiesCommunities  can examine and share the data  and  go through a process of equitable community engagement to determine where to focus their efforts.  Once they understand and identify  where they want to  work, communities can use the Active People, Healthy Nation  strategies  that  work  to narrow their focus on actions they want to take to increase active lifestyles.  


References   

  • Fulton JE, Buchner DM, Carlson SA, et al. CDC’s Active People, Healthy NationSM: Creating an Active America, Together. Journal of Physical Activity and Health. 2018;15(7):469-473. doi:10.1123/jpah.2018-0249 
  • Schmid TL, Fulton JE, McMahon JM, Devlin HM, Rose KM, Petersen R. Delivering Physical Activity Strategies That Work: Active People, Healthy NationSM. Journal of Physical Activity and Health. 2021;18(4):352-356. doi:10.1123/jpah.2020-0656 

Disclaimer: The findings and conclusions in this report are those of the authors and do not necessarily represent the official position of the Centers for Disease Control and Prevention. 

Authors:  

Ken Rose,  MPA,  Branch Chief, Physical Activity and Health Branch, Division of Nutrition, Physical Activity and ObesityCenters for Disease Control and Prevention 

Emily Ussery, PhD,  EpidemiologistPhysical Activity and Health BranchDivision of Nutrition, Physical Activity and ObesityCenters for Disease Control and PreventionLCDR, US Public Health Service 

Kaitlin Graff, MSW, MPH, Program Coordinator,  McKing Consulting/Physical Activity and Health BranchDivision of Nutrition, Physical Activity and ObesityCenters for Disease Control and Prevention 

Facebook: @CDCEatWellBeActive 

Twitter: @CDC_DNPAO 

#activepeople 

arlington virginia at sunset

What Makes Arlington, Virginia the Fittest City in America?

The American Fitness Index scores the country’s 100 largest cities (based on population) on 34 indicators of health. These indicators are broken into two categories: personal health, which measures the health of residents in the community, and community/environment, which measures both efforts that are undertaken by local authorities to promote health and fitness and the scale to which the environment promotes healthy behaviors. Arlington, VA earned the #1 overall ranking in the 2021 ACSM American Fitness Index with a score of 86.1 out of a possible 100. This is the 4th consecutive year that Arlington has been named the “Fittest City in America.”


What makes Arlington so fit?

Arlington ranked first in both the personal health and community/environment sub-scores. At the individual indicator level, Arlington ranked among the top 10 cities for 18 of the 34 indicators in the Fitness Index, with eight indicators ranked #1.

Arlington was ranked #1 for the following indicators:

  • Lowest percentage of residents with angina or coronary heart disease (.3%)
  • Lowest percentage of residents who smoke (3.5%)
  • Lowest percentage of residents with high blood pressure (15.2%)
  • Lowest percentage of residents experiencing food insecurity (6.7%)
  • Lowest percentage of residents with diabetes (4.2%)
  • Lowest percentage of residents with poor physical health in the previous month (24.1%)
  • Highest percentage of residents in excellent or very good health (66.9%)
  • Highest percentage of residents exercising in the previous month (85.7%)

Arlington ranked in the top 10 for the following indicators:

  • Percentage of residents who use public transportation to go to work
  • Percentage of residents who consume 2+ fruits per day
  • Percentage of residents who sleep 7+ hours per day
  • Percentage of residents with poor mental health (lowest)
  • Percentage of residents with obesity (lowest)
  • Percentage of residents who have experienced a stroke (lowest)
  • Bike Score
  • Percentage of residents who live within a 10-minute walk to a park
  • Number of tennis courts per 10,000 residents

See how the 99 other ranked cities compare to Arlington using the City Comparison Tool.

city with safe bike lanes

How High Is Your Bike Score? Barriers to Bikeable Communities

Moving to a new city in the middle of the COVID-19 pandemic could have made for a difficult transition. Without the typical options of going out to restaurants, concerts or sporting events, getting to know our new home presented with some challenges. When my husband and I moved to Minneapolis in June of 2020, we were both sidelined from running by injuries. Fortunately, the vastly connected bike trails in the city gave us an excellent way to explore our new city and stay safely distanced. We quickly found ourselves riding our bikes for longer than we ever had before, and one of the key reasons we continued to cycle was that it was “easy.” We weren’t fighting car traffic in the bike-only lanes. We never ran into areas where the bike lanes abruptly ended, so thankfully, we never had to merge with vehicular traffic. I do not enjoy cycling while cars speed past with little concern for others on the road, but Twin Cities bike trails were relatively protected from this. My biggest complaint was that at times there were too many cyclists (how could I say such a thing)!

During medical school, I would cycle commute to class, but I only had to travel a mile on streets that were not busy (though there were no bike lanes). I’ve considered cycling to work at times since, but several barriers existed, including community factors such as lack of infrastructure connectivity (bike lanes that connect to one another and do not require you to abruptly merge with vehicular traffic), lack of protected bike lanes and sidewalks and poor lighting, as well as personal factors such as not having access to a shower when I get to work. In Minneapolis, so many residents cycle commute or just ride for exercise, and now I understand why: the city infrastructure makes it easy and enjoyable. This made me think more about what needs to be done for those in other cities to have the opportunity to reap the benefits of cycling carefree in their communities.

Cycling to work or school has many benefits, including:

    • Increased physical activity which may lead to decreased risk of chronic disease
    • Reduced carbon footprint
    • Avoidance of traffic jams
    • Decreased risk of contracting COVID-19 through public transportation
    • Improved mood and cognition
    • Help people achieve the American College of Sports Medicine recommendations of 150 minutes of physical activity per week
    • Save money, as cycling is less expensive than owing and driving a car

Despite the benefits, there are barriers to cycling in many communities, including infrastructure connectivity, lack of protected bike lanes or sidewalks and poor lighting. Infrastructure connectivity is one of the primary barriers to cycling in cities in the United States. Complete Streets policies can help create communities where the choice to be active every day is easier and safer. Complete streets are designed to prioritize safety, comfort and right of way to walkers and cyclists to help create livable communities by prioritizing safety and public health. Eliminating additional barriers to cycling, such as narrow bike lanes, lack of separation from motor vehicles, challenging intersection crossings and snow-and-ice-covered bike paths are ways to make people feel more comfortable cycling.

USA map bike score 2020Although the ultimate choice to be active or cycle to work lies with each individual, providing access to safe, interconnected and well-lit bikeways should be a community responsibility, and community policies can help prioritize cyclists when planning a city’s infrastructure. The ACSM American Fitness Index assesses infrastructure connectivity using four indicators, one of which is the Bike Score®. Minneapolis, MN ranks #1 in Bike Score®, followed by Portland, OR, Chicago, IL, Denver, CO, and San Francisco, CA. But what has allowed these cities to rise to the top of the list? They primarily have a well-connected infrastructure with well-marked bike lanes that are often separate from motor vehicle traffic. Minneapolis implemented a Complete Streets Policy in 2016 that prioritizes pedestrians first, followed by bicycling and transit use and lastly motor vehicle use. Minneapolis has a growing bikeway network that encourages people of all ages to cycle throughout the year, both for exercise and when commuting. Many other cities have adopted a similar bikeway infrastructure, but there are still many cities that lack safe and well-connected bike lanes.


Author: Allison Schroeder, MD is  a Sports Medicine Fellow at Mayo Clinic Square in Minneapolis, MN. She will be joining the Department of Physical Medicine and Rehabilitation at the University of Pittsburgh Medical Center as faculty beginning in August of 2021.