Tag: ACSM American Fitness Index

active transportation

Active Transportation Choices May Affect Your Wallet and Waistline

It is not surprising that having healthy habits, like walking every day, is one way to fight the holiday bulge. But did you know that it can also keep a little extra padding in your pocketbook? As colder weather sets in many of us look forward to a fun and festive holiday season. This busy time of year and its blustery winter weather can also mean that some of our summertime activities and active transportation habits become a distant memory. Add to that the surplus of heart-warming treats and holiday beverages, and it’s easy to see why so many of us set resolutions to lose weight and exercise more when January 1st rolls around.

Active transportation is known as a solid way to get active, which can save on health care costs. Active transportation typically means walking or biking to get from place to place, but can also include using public transportation, where the active component is getting to and from stations or stops. An example of this comes from Toronto, Canada. Estimates from proposed improvements to the region’s transportation system would increase transit use by 7.8 percent. When these people switch from cars to transit, it’s projected to prevent 338 deaths, 1,000 cases of diabetes, and $1.67 billion USD ($2.2 billion CA) in annual health savings. It’s noteworthy that not all of these savings are from increased physical activity, as factors such as emissions reductions and reduced traffic fatalities were included in the estimates, but who’s going to scoff at those added benefits?

Of course, transitioning to walking places or taking public transit when you’re not doing so already isn’t easy. This is likely because of 60-plus years of development across the American landscape that prioritized sprawling, disconnected suburbs. Add to that an American culture with a deep fondness for car ownership and personal travel, and it takes planning and motivation to make active transportation a part of your daily routine. However, these changes are comfortable when a city builds activity-supportive environments.

For over 10 years, the American Fitness Index has monitored transportation systems and activity-supportive environments as key influencers of community fitness. This report evaluates the healthiness of cities – including several measures of active transportation. The percent of a city’s inhabitants who walk, bike or use public transportation to get to work, and the city’s average Walk Score – which measures how walking-friendly an area is for daily errands – are critical components of the overall Fitness Index rankings.

The Fitness Index aims to help public officials, concerned citizens, local community groups and health organizations assess the essential aspects of their city’s overall health and quality of life. While you plan to dig out the winter wardrobe, take some time to motivate yourself to walk, bike or even take public transit on your next outing, not only to fight that holiday bulge, but maybe save a little extra money for the holiday gift fund.


Author: Jane C. Hurley 

Anchorage Alaska Parks

Love parks? Anchorage, Alaska is the place for you!

Anchorage has more public access to park space per city acre than any other state in the United States, and its extremely variable climate presents the unique opportunity of hosting both winter and summer sports. Anchorage, the largest city in the state of Alaska, is surrounded by majestic mountain ranges and covered with forest and open fields. Recently, Anchorage was top of the “Parks” category in the 2018 American College of Sports Medicine’s American Fitness Index.

The Municipality of Anchorage, with 84.2 percent covered in parkland, easily leads the country for space designated to parks in a city. Anchorage also ranks first in the category of acres of parkland per 1,000 residents with over 223 parks, each averaging 4.7 acres in size. Up to 71% of Anchorage’s residents live within a ten-minute walk to one of its many parks. Most parks are available for use year-round, and the activities change along with the seasons. In the summer, temperatures reach as high as 90° F, averaging a comfortable 65° F. Soccer, football, disc golf and cycling are a common sight at local parks. Families spend time on the playgrounds and walk along Anchorage’s scenic trails. In the winter, however, temperatures can drop below -30° F, and Anchorage averages 74 inches of snow per year. Those conditions don’t stop the community from using their parks, but rather open up opportunities for cross country skiing on the freshly groomed 250 miles of trails, as well as downhill skiing, snowboarding and snowshoeing in the backcountry. Additionally, many of Anchorage’s outdoor parks and facilities are designed for use during both winter and summer. Basketball courts and lakes, for example, are often “hot-mopped” and converted to free outdoor skating rinks.

Kincaid Park Anchorage Alaska
1,500 acre Kincaid Park is one of the most popular parks in Anchorage, Alaska.

One of the most popular parks is the 1,500-acre Kincaid Park. It is well known for its sand dunes and access to the beach, and a goat-trail path along a breathtaking 300-foot bluff. The community has free access to soccer fields, a disc golf course, archery, fishing and wildlife viewing. Many community groups, such as the University of Alaska Anchorage Nordic Ski Team, take advantage of nearly 40 miles of world-class trails, all of which are groomed over in winter and used for roller skiing during the summer. The park has been a host for many community, high-school and college ski races, as well as U.S. National Championships and Olympic trials.

Volunteers are an integral part of maintaining and beautifying Anchorage parks and trails. Every year, volunteers contribute thousands of hours of service to the Parks and Recreation Department because the people of Anchorage value their outdoor space. In 2013, volunteers tallied over 125,000 hours of service to Anchorage parks. From general upkeep to specific jobs like grooming trails and prepping outdoor skating rinks, the volunteers are the reason that Alaska’s parks remain world-class.

With all of its magnificent parks, it’s obvious why outdoor enthusiasts are drawn from all over the world to visit Anchorage. Whether winter or summer, Anchorage is the perfect place to get moving outside and enjoy all that the 49th state has to offer without having to drive more than 20 miles in any direction.

Authors: Maryann Hoke, Junland Navarro, Yvonne Jeschke, Liam Lindsay and Darrion Gray of the Health, Physical Education and Recreation Department of the University of Alaska Anchorage and Alaska Regional Chapter of the American College of Sports Medicine. 

Parks: More Than Just a Playground

Summertime is in full swing, and, for many of us, it’s the time of year we consider engaging with the great outdoors. However, as much as we might like, we can’t make every day a journey into nature … or can we? Local parks are a significant way to bring a piece of nature into our neighborhoods. And perhaps surprisingly, they may be doing a lot more good than just being a place to take the kids for a push on the swing.

It’s not a stretch of the imagination that parks help communities be more physically active. The relationship between parks and activity levels is so strong that the American Fitness Index – a ranking that evaluates the health and fitness of cities – includes several measures of parks in a community. For example, the rankings look at the total number of parks, the percent of residents living within a ten-minute walk to a park, and even local government spending on parks, a policy-level consideration. These are just a few featured indicators that are used to evaluate the cities that are ranked yearly.

Science shows that in addition to getting people to move more, parks also improve mental well-being and are essential for community connectedness—a critical aspect of social health.

One might wonder how a simple park can achieve so much! The open space or grassy areas in parks are great places to play catch with a friend or do exercises on your own. In addition, parks provide beautiful tree canopies for walking and moments of tranquility. And of course, many parks have sports fields or courts for team activities, outdoor gyms, and playground equipment for kids that can easily be repurposed for working out.

And what about mental health? The mental health community knows that “greenspace” positively impacts psychological well-being. Greenspace is an umbrella term that includes both open wilderness and urban parks and has been linked to greater mental health and well-being. Not only do parks and greenspace support physical activity, which is well known to improve mental health, but they also benefit psychological health through peaceful and relaxing sounds as well as feelings of closeness to nature. Related to this are the benefits parks and greenspace may have to social health, one driver of which is community connectedness. The physical parkland area may attract family, friends, and the larger community to come together for various social reasons.

And finally, parks may actually be saving money in health care costs. A recent UK report found that park users are healthier – saving an astonishing £111 million (US$146 million) in medical expenses for that country.

The parks in our neighborhoods are spaces that can contribute significantly to our health and well-being. While seasonal activities are a great way to get outdoors, for many, local parks are accessible nearly every day of the year. See how your city ranks on parks plus many other health and fitness indicators in the 2018 American Fitness Index.

Author

Jane C. Hurley 

2018 American Fitness Index Overview Infographic

According to the 2018 ACSM American Fitness Index, the top 10 fittest cities in the U.S. are:

  1. Arlington, VA
  2. Minneapolis, MN
  3. Washington, D.C.
  4. Madison, WI
  5. Portland, OR
  6. Seattle, WA
  7. Denver, CO
  8. St. Paul, MN
  9. San Jose, CA
  10. Boise, ID

Share this infographic and the Fitness Index with your city officials and local leaders to start a conversation on making your city a healthier place for all residents.

Download a PDF of the Infographic here.

10th Annual American Fitness Index Reveals Minneapolis-St. Paul as the Newest “Fit City”

Half of metro areas saw scores improve

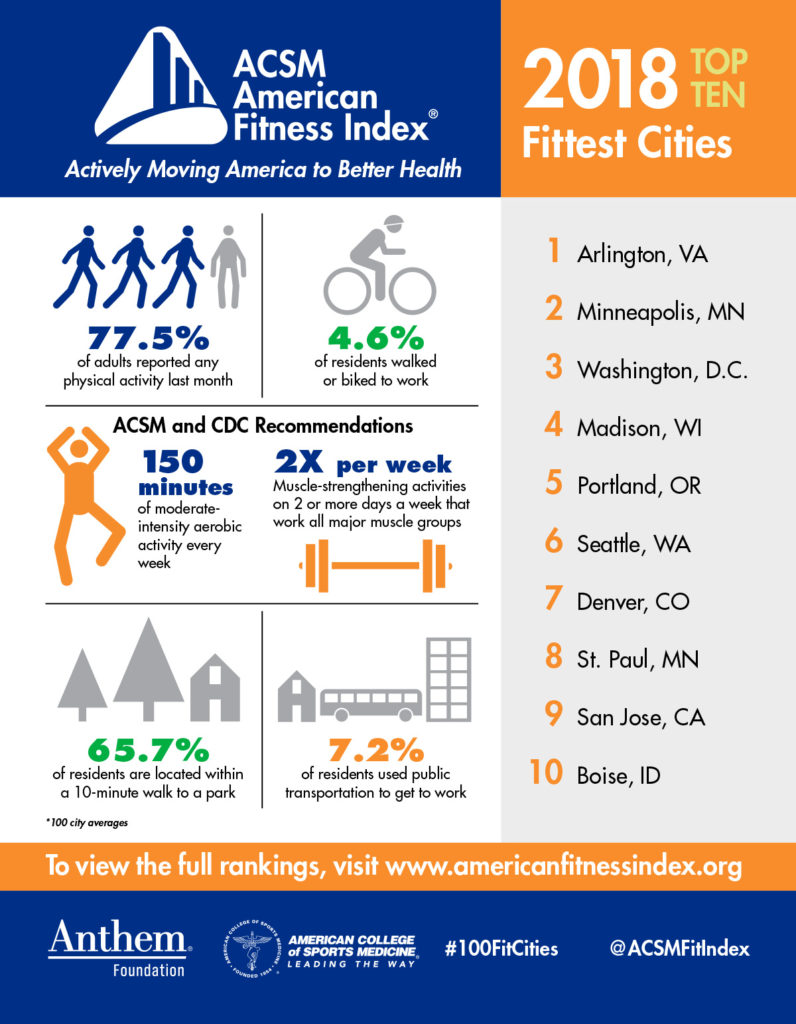
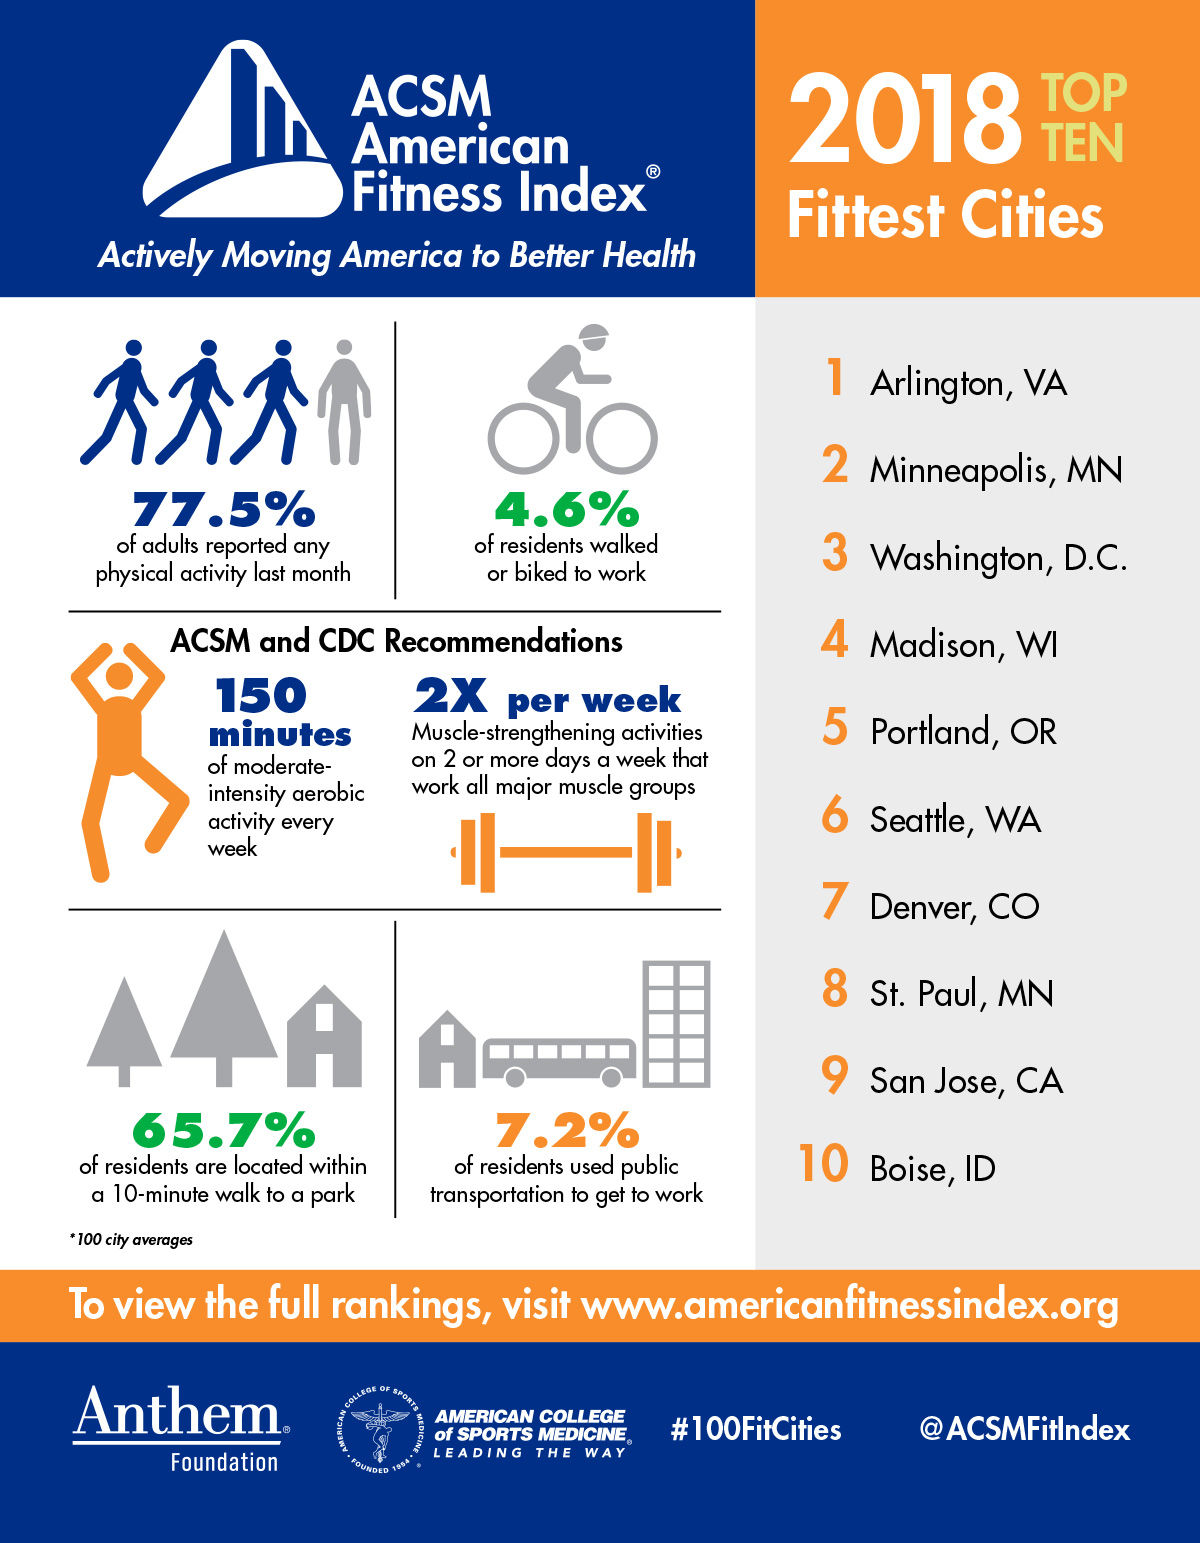
Indianapolis (May 16) – The twin cities of Minneapolis-St. Paul edged Washington, D.C. in the 10th annual American Fitness Index (Fitness Index) rankings released by the American College of Sports Medicine (ACSM) and the Anthem Foundation, the philanthropic arm of Anthem, Inc.  The nation’s capital held the top spot for the past three years and improved its score in 2017, but Minneapolis-St. Paul still finished on top despite the challenges of being a northern state with hard winters. (Link – View the rankings and individual metro data here or at the chart below.)

San Francisco-Oakland finished third this year, Seattle-Tacoma fourth, San Jose fifth, Boston sixth and Denver seventh. The top seven cities in the 2017 Fitness Index are between 4-13 percentage points ahead of the rest of the pack, principally related to lower rates of smoking and cardiovascular disease deaths and higher reported physical activity, consumption of fruits and vegetables, and per capita park expenditures in their communities.

Nationally, there were some remarkable positive shifts during the last year:

  • 16.0% increase in the percent who met the recommendations for aerobic and strength in the last 30 days
  • 10.5% drop in the percent with diagnosed angina or coronary heart disease
  • 3.9% increase in walkability scores
  • 3.9% increase in the percent who live within a 10-minute walk to a park
  • 3.7% increase in the total park expenditures per capita
  • 4.0% increase in the number of recreation centers per 20,000 residents

Metropolitan Statistical Areas (MSA) with the greatest improvement in their rankings since last year included San Jose, Los Angeles, Miami, Buffalo, Orlando and Las Vegas.

The 2017 Fitness Index rankings also revealed some shortcomings over the past year:

  • 11.7% increase in the rate of diabetes deaths
  • 6.3% reduction in the percent of residents biking or walking to work
  • 6.2% decrease in the percent of individuals eating the recommended number of servings of fruit
  • 4.6% reduction in the number of tennis courts per 10,000 residents

MSAs experiencing the largest drop in their rankings this year included Virginia Beach, Richmond, Providence, Philadelphia, Kansas City, New Orleans and Charlotte.

Against the backdrop of its 10th anniversary,  the Fitness Index offers some insightful long-term trends:

    • Smoking rates have declined (18.7% to 16.7%)
    • Drops in the death rates for diabetes (24.0/100,000 to 18.7/100,000) and cardiovascular diseases (223.0/100,000 to 174.6/100,000)
    • The number of farmers’ markets have increased (11.0/1,000,000 to 19.8/1,000,000)
    • Increases in the percent of residents using public transportation to work doubled (2.1% to 4.4%)
    • Residents biking or walking to work doubled (1.3% to 2.9%)
    • Total park expenditures per capita increased ($100 to $106)

Conversely, the 10-year comparison of Fitness Index indicators uncovered some challenges:

    • The percent categorized as obese increased (25.4% to 28.7%)
    • The percent self-reporting as having excellent or very good health declined (55.6% to 52.1%)
    • The percent diagnosed with asthma increased (8.2% to 9.0%), as did the percent with diabetes (8.0% to 10.7%)

The ACSM American Fitness Index provides evidence-based data and a number of valuable resources that help cities promote healthy lifestyles.  To aid communities in promoting physical activity and enhancing quality of life, ACSM and Anthem Foundation developed and released  the Community Action Guide offering an overview of the critical decisions and factors related to effective community action:  https://americanfitnessindex.org/community-action-guide/

“Our ultimate goal is to offer individuals, families and communities trusted resources that can help them assess, plan and implement policies that promote positive health outcomes,” said Walter R. Thompson, Ph.D., FASCM, who chairs the Fitness Index Advisory Board and is president-elect of ACSM. “Ten years of evidence-based data offers these cities and their citizens valuable insights into how to substantively improve elements leading to healthier lives and reduced health care costs.”

“As the American Fit Index celebrates its 10th year, it’s a great opportunity to celebrate the efforts of communities and their leaders who have effectively used the data to make measurable changes that are helping improve the health and wellness of their residents,” said Craig Samitt, MD, chief clinical officer, Anthem, Inc. “While the improvements we are seeing are worth celebrating, we know there is still more that can be done. We are proud of our foundation’s work and collaboration with ACSM to offer science and evidence for communities to create a culture of healthy lifestyles.”

At the community level, the Fitness Index has been used as an assessment and evaluation tool to educate community leaders on the importance of key indicators of physical activity. Leaders can then focus on policy, systems and environmental change strategies that are evidence-based and create sustainability for the community.

The 2017 ACSM American Fitness Index rankings are as follows:

2017 Rank 2016 Rank Metropolitan Area 2017 Score
1 2 Minneapolis-St. Paul-Bloomington, MN-WI 80.2
2 1 Washington-Arlington-Alexandria, DC-VA-MD-WV 79.2
3 5 San Francisco-Oakland-Hayward, CA 73.3
4 6 Seattle-Tacoma-Bellevue, WA 72.2
5 11 San Jose-Sunnyvale-Santa Clara, CA 71.6
6 7 Boston-Cambridge-Newton, MA-NH 71.5*
7 3 Denver-Aurora-Lakewood, CO 71.5*
8 4 Portland-Vancouver-Hillsboro, OR-WA 67.7
9 8 Salt Lake City, UT 66.3
10 10 San Diego-Carlsbad, CA 65.6
11 13 Sacramento–Roseville–Arden-Arcade, CA 63.3
12 15.5± Austin-Round Rock, TX 61.2
13 9 Hartford-West Hartford-East Hartford, CT 60.5
14 15.5± Raleigh, NC 58.6
15 12 Chicago-Naperville-Elgin, IL-IN-WI 58.4
16 29 Los Angeles-Long Beach-Anaheim, CA 55.7
17 14 Atlanta-Sandy Springs-Roswell, GA 55.0
18 22 New York-Newark-Jersey City, NY-NJ-PA 54.5
19 26 Tampa-St. Petersburg-Clearwater, FL 54.1
20 17 Baltimore-Columbia-Towson, MD 54.0
21 20 Milwaukee-Waukesha-West Allis, WI 53.9*
22 23 Cincinnati, OH-KY-IN 53.9*
23 32 Miami-Fort Lauderdale-West Palm Beach, FL 52.6
24 35 Buffalo-Cheektowaga-Niagara Falls, NY 52.5
25 43 Orlando-Kissimmee-Sanford, FL 52.3
26 28 Saint Louis, MO-IL 51.6
27 19 Virginia Beach-Norfolk-Newport News, VA-NC 50.7
28 25 Cleveland-Elyria, OH 50.0
29 27 Pittsburgh, PA 49.0
30 18 Richmond, VA 48.9
31 21 Providence-Warwick, RI-MA 48.4*
32 24 Philadelphia-Camden-Wilmington, PA-NJ-DE-MD 48.4*
33 34 Phoenix-Mesa-Scottsdale, AZ 47.3*
34 41 Las Vegas-Henderson-Paradise, NV 47.3*
35 31 Jacksonville, FL 46.0
36 30 Kansas City, MO-KS 45.0
37 36 Riverside-San Bernardino-Ontario, CA 44.5
38 37 Dallas-Fort Worth-Arlington, TX 43.2
39 33 New Orleans-Metairie, LA 41.7
40 40 Houston-The Woodlands-Sugar Land, TX 39.0
41 38 Columbus, OH 37.4
42 46 Nashville-Davidson–Murfreesboro–Franklin, TN 36.8
43 42 Detroit-Warren-Dearborn, MI 35.8
44 45 San Antonio-New Braunfels, TX 34.7
45 47 Memphis, TN-MS-AR 33.2
46 44 Birmingham-Hoover, AL 31.2
47 39 Charlotte-Concord-Gastonia, NC-SC 30.3
48 50 Indianapolis-Carmel-Anderson, IN 29.9
49 49 Oklahoma City, OK 29.4
50 48 Louisville/Jefferson County, KY-IN 23.1

±There was a tie in the ranking between the MSAs.

*The scores shown have been rounded to the nearest tenth of a point resulting in some apparent ties; however, the rankings are based on the full calculated score values that were not equal in those cases.

Methodology

ACSM, the Indiana University School of Family Medicine and a panel of 26 health and physical activity experts developed the methodology to analyze U.S. Census data; data from the U.S. Centers for Disease Control and Prevention’s Behavioral Risk Factor Surveillance System (BRFSS); The Trust for the Public Land City Park Facts; and other existing research data in order to give a scientific, accurate snapshot of the health and fitness status at a metropolitan level.

ACSM is a global leader in promoting the benefits of physical activity and advocates for legislation that helps government and the health community make it a priority. ACSM encourages Congress to support continued funding of parks, trails and safe routes to school, as well as the need for all Americans to meet the prescribed physical activity recommendations included in the National Physical Activity Guidelines, and the need for the guidelines to be regularly updated every 10 years.

The data is made up of personal health, community and environmental indicators. Visit the online newsroom at www.AmericanFitnessIndex.org for a complete list of the data components.

About the American College of Sports Medicine

The American College of Sports Medicine is the largest sports medicine and exercise science organization in the world. More than 50,000 international, national and regional members are dedicated to advancing and integrating scientific research to provide educational and practical applications of exercise science and sports medicine.   More details can be found at http://www.acsm.org/

About Anthem Foundation

The Anthem Foundation is the philanthropic arm of Anthem, Inc. and through charitable contributions and programs, the Foundation promotes the inherent commitment of Anthem, Inc. to enhance the health and well-being of individuals and families in communities that Anthem, Inc. and its affiliated health plans serve. The Foundation focuses its funding on strategic initiatives that address and provide innovative solutions to health care challenges, as well as promoting the Healthy Generations Program, a multi-generational initiative that targets specific disease states and medical conditions. These disease states and medical conditions include: prenatal care in the first trimester, low birth weight babies, cardiac morbidity rates, long term activities that decrease obesity and increase physical activity, diabetes prevalence in adult populations, adult pneumococcal and influenza vaccinations and smoking cessation. The Foundation also coordinates the company’s year-round Associate Giving program which provides a 50 percent match of associates’ pledges, as well as its Volunteer Time Off and Dollars for Doers community service programs. To learn more about the Anthem Foundation, please visit http://www.anthem.foundation and its blog at http://anthemfoundation.tumblr.com.

July is National Park and Recreation Month!

Since 1985, America has celebrated July as the nation’s official Park and Recreation Month. The American Fitness Index recognizes the importance of community parks and recreational areas and the role they play as a contributing environmental indicator for better health and physical activity.

OUT is IN

A study conducted for the National Recreation and Park Association (NRPA) found that 3 in 10 U.S. adults do not spend time outdoors on a daily basis. NRPA wants to break that trend with their OUT is IN campaign. The program emphasizes how parks and recreation services are vital assets for our communities in battling the obesity epidemic and chronic disease.

Get out there and play!

Taking advantage of your local public park is a simple and economical way to improve your physical fitness. Parks offer children and adults an opportunity to engage in moderate to vigorous physical activity during their visit.  According to the Centers for Disease Control and Prevention, having access to parks and playgrounds can initiate other healthy lifestyle choices.

What are some other ways parks can promote health?

Want to see first hand what parks and recreation can do to benefit your health? The Trust for Public Land created this fun video on how your local park makes an impact on your health and the health of your community.

Today Show Looks to ACSM for America’s Healthiest City

To help kick off 2014, The Today Show looked at where in America you should go if you want to be “healthy, wealthy and wise”.

In their search for evaluating America’s healthiest cities, the show’s producers examined a number sources and ultimately settled on the ACSM American Fitness Index®. For the past three years Minneapolis/St. Paul has earned the highest ranking.

ACSM and the Fitness Index Advisory Board are honored to be considered as the best measure of a “healthiest” city. It’s a testament to the research and planning that went into creating the Fitness Index and the work to update the rankings each year since 2008.

For the segment on The Today Show, journalist Craig Melvin spoke with runners and bikers using the city’s expansive trails and paths, highlighted Minneapolis’ robust park and recreation system, and featured a healthy food program called Urban Roots.

The segment also included a portion of an interview with Fitness Index Advisory Board Chair Dr. Walt Thompson.

Check out the segment and read the story on The Today Show website. The 2014 report will be released in May ahead of the ACSM Annual Meeting.

Visit NBCNews.com for breaking news, world news, and news about the economy

Minneapolis-St. Paul Tops Fit List for Second Straight Year

For the second consecutive year, Minneapolis-St. Paul is the healthiest, fittest metropolitan area in the United States, according to the American College of Sports Medicine’s (ACSM) annual American Fitness Index® ().

Made possible by a grant from the WellPoint Foundation, the 2012 data report, “Health and Community Fitness Status of the 50 Largest Metropolitan Areas,” evaluated the most populous city areas to identify the healthiest and fittest places in the United States. Minneapolis-St. Paul-Bloomington achieved a high score of 76.4 (out of 100 possible points) to capture the top ranking.

Check out the Quick View to see how each metro area ranked. A full copy of the 2012 data report is available at https://americanfitnessindex.org/report.

The data report reflects a composite of preventive health behaviors, levels of chronic disease conditions, health care access and community resources and policies that support physical activity. New to the 2012 data report is a benchmark for each data indicator to help identify areas that need improvement.

“Although many people will gravitate to which cities are fit or less fit, it’s important to remember that there is room for improvement in every community,” added Thompson. “It’s also worth noting that even the lowest-ranked areas have healthy residents and community resources that support health and fitness.”

To assist with measurement and to provide a baseline measure of health and fitness status, ACSM worked with the Indiana University School of Family Medicine and a panel of 26 health and physical activity experts on the methodology of the data report. Researchers analyzed the data gleaned from U.S. Census data, the U.S. Centers for Disease Control and Prevention’s Behavioral Risk Factor Surveillance System (BRFSS), The Trust for the Public Land City Park Facts and other existing research data in order to give a scientific, accurate snapshot of the health and fitness status at a metropolitan level.

The data examined fall into two categories:

  1. Personal health indicators
  2. Community and environmental indicators

Building a Healthier Chicago!

ACSM has been proud to work with Assistant Surgeon General Dr. James M. Galloway in the early years of the ACSM American Fitness Index. Dr. Galloway spoke about the importance of the data report to the Building a Healthier Chicago! initiative upon the launch of the program in 2008.

Building a Healthier Chicago! is a collaborative endeavor between the American Medical Association, the Chicago Department of Public Health, and the Office of the Regional Health Administrator of the U.S. Department of Health and Human Services – Region V.

The goal of the campaign is to improve the health of Chicago’s residents and employees through the integration of existing and new public health, medicine and community health activities.

The campaign involves several programs including:

  • F.I.T. City: A restaurant initiative to develop and promote F.I.T. (Fresh, Innovative, and Tasty) menu options through partnerships with restaurants, chefs, culinary schools, health advocates, and community groups.
  • Focus Community: Specific program to help the Austin community, located on Chicago’s west side, gain access to healthy foods. Austin is the most densely populated community within Chicago, but has no chain supermarket thus residents have limited access to healthy foods. Parts of Austin have even been designated as “food deserts.”
  • Building a Healthier Chicago’s Agribusiness: A project aimed to set up markets in food deserts to give residents access to affordable fruits and vegetables. The program worked with the DePaul University Graduate School of Business to create a simple market concept- sell food for a dollar each – two apples for a dollar, four potatoes for a dollar, etc.
  • “Federal Employees: Active and Healthy…Working Well”: A worksite wellness program for federal employees aimed to improve the culture of the city’s federal workplaces to encourage employee wellness through healthy eating, and various physical activities.

Chicago ranked 28th in the most recent ACSM American Fitness Index® () data report, which evaluates the 50 most populous city areas and identifies the healthiest and fittest places in the United States. The metro area earned a score of 48.9 (out of 100 possible points) in 2011.

The metro area ranked 34th on personal health indicators related to health behaviors, chronic health problems and health care, and 21st on community/environmental indicators related to the built environment, recreational facilities, park-related expenditures, physical education requirements and primary health care providers.

Pertinent to Building a Healthier Chicago, only 22.5% of the population reports eating 5+ servings of fruits/vegetables a day. However, the area has an above average number of farmers’ markets (17.7/1,000,000).

Building a Healthier Chicago! operates under the Social Ecological Model, which acknowledges how environmental factors impact the decisions people make. This model combines these multiple perspectives and promotes a healthy environment/lifestyle suited for the social space in which people live, eat, work and play.

For more information, please visit: healthierchicago.org.

Building a Healthier Chicago

Oklahoma City’s Wellness Now Initiative

From time to time, we like to highlight community initiatives and programs that are making a difference. Wellness Now is a community-led initiative in Oklahoma City, Okla., aimed at addressing the city’s health problems. Oklahoma City ranked 50th in the most recent ACSM American Fitness Index® () data report, which evaluates the 50 most populous city areas and identifies the healthiest and fittest places in the United States. The metro area earned a score of 24.6 (out of 100 possible points) in 2011.

Oklahoma City struggles with a wide variety of health problems including obesity and tobacco use, both of which are contributors to heart disease, diabetes and other chronic illnesses. The study reports 28.6% of the city’s population being obese and 22.8% currently smoking. As a result, the city ranks 50th in personal health indicators with a score of 15.6.

Wellness Now, started in April of 2010, is a collaboration between nearly 100 community partners including schools, health care professionals, elected officials from all levels of government, faith-based and community-based organizations, and private sector companies all dedicated to making necessary changes in order to create a healthy community. In addition to the program’s partners, Wellness Now relies heavily on people in the neighborhoods to participate in surveys and community forums.

The program is chaired by Oklahoma City Mayor Mick Cornett and County Commission Chairman Ray Vaughn, and addresses the following public health priority areas:

  • Obesity
  • Mental Health
  • School Health
  • Senior Health
  • Tobacco Use Prevention
  • Obstacles to Health
  • Maternal & Child Health
  • Chronic Disease

For example, the program aims to increase access to and consumption of healthy, safe and affordable food, encourage physical activity, and promote local ordinances requiring 100% smoke-free workplaces. For more examples on specific actions for each of the above mentioned public health priority areas, check out http://www.occhd.org/community/wellnessnow/action

For more information on Wellness Now, visit http://www.occhd.org/community/wellnessnow or https://www.facebook.com/WellnessNowInitiative.