Category: In the News

halloween safety tips

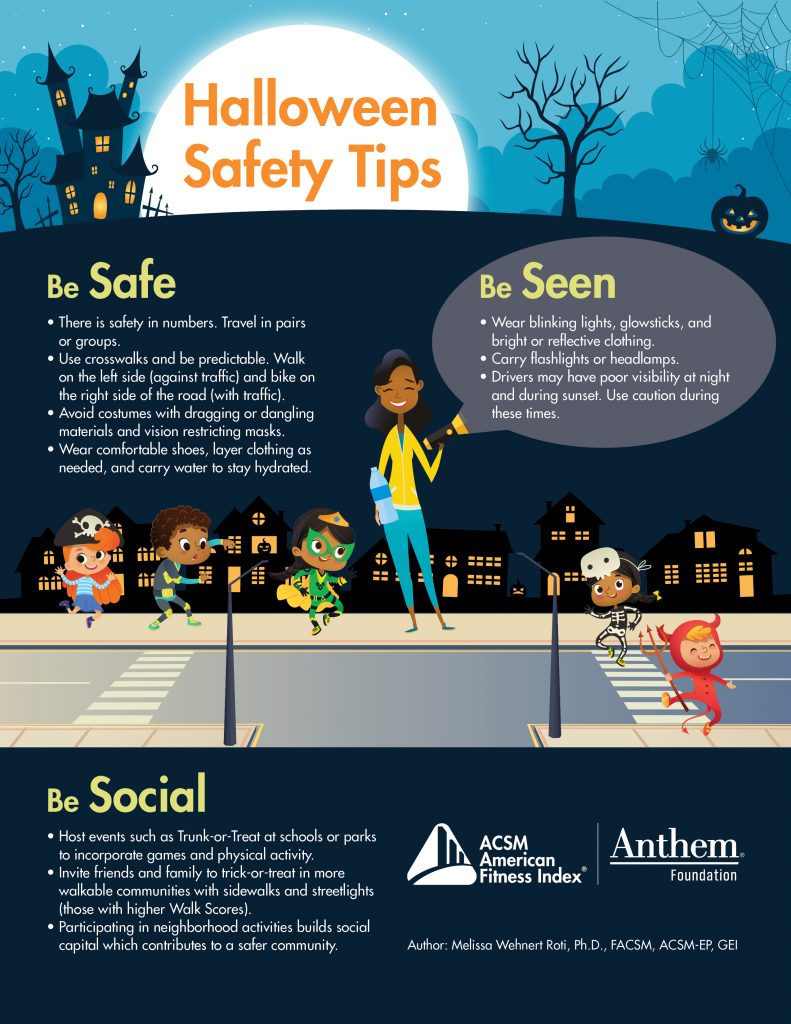
Halloween Safety Tips

Halloween can be a fun holiday for families if you follow these safety tips to keep trick-or-treaters and party goers safe at night!

Be Safe

• There is safety in numbers. Travel in pairs or groups.
• Use crosswalks and be predictable. Walk on the left side (against traffic) and bike on the right side of the road (with traffic).
• Avoid costumes with dragging or dangling materials and vision restricting masks.
• Wear comfortable shoes, layer clothing as needed, and carry water to stay hydrated.

Be Seen

• Wear blinking lights, glowsticks, and bright or reflective clothing.
• Carry flashlights or headlamps.
• Drivers may have poor visibility at night and during sunset. Use caution during these times.

Be Social

• Host events such as Trunk-or-Treat at schools or parks to incorporate games and physical activity.
• Invite friends and family to trick-or-treat in more walkable communities with sidewalks and streetlights (those with higher Walk Scores).
• Participating in neighborhood activities builds social capital which contributes to a safer community.

halloween safety tips


Have fun and enjoy a safe holiday!

Download the Infographic 

Author: Melissa Wehnert Roti, Ph.D., FACSM, ACSM-EP, GEI

American Fitness Index Anthem Foundation fresh food availability

Supporting Local Communities in the Fight Against Food Insecurity

The American Fitness Index serves as a tool and resource for community stakeholders to address conditions in the environments that negatively affect a person’s overall health and identifies target areas to create healthier, more active communities.

Eliminating food insecurity is a critical factor in improving the overall health and well-being of individuals in the communities we serve, which is why the Anthem Foundation recently partnered with The Food Trust. Our collaboration will expand The Food Trust’s community-based program, the Healthy Food Retail Initiative, aimed at increasing access to healthy food and promoting health equity in cites in Indiana, Ohio and California.

Through our work with ACSM and programs like the Indianapolis Healthy Food Retail Initiative with The Food Trust, the Anthem Foundation is committed to creating meaningful partnerships with organizations, targeting specific, preventable health concerns and addressing the conditions in our environments which negatively impact individuals within communities.

For example, the 2019 Fitness Index found that only 33.9 percent of Indianapolis residents are eating two or more fruits a day and just 15.1 percent of residents are eating three or more vegetables each day. Data also showed more than one in three Indianapolis residents live in low food access areas where fresh food is difficult to find. Through these findings, it was clear that far too many Hoosiers are living without reliable access to a sufficient supply of affordable, nutritious food.

Fortunately, our partnership with The Food Trust recently expanded the Healthy Food Retail Initiative into five additional communities on the Eastside of Indianapolis, with markets and convenience stores increasing inventory and promotion of fresh produce and other heart-healthy foods. These locations also serve as “community health hubs” by providing health screenings, nutrition education and cooking lessons.

We believe giving back is not only a privilege, but a responsibility that we all share. Since the Foundation’s inception, we have remained committed to improving health and strengthening local communities through contributions to organizations committed to empowering communities to create healthier generations.


Author: Stephen Friedhoff, MD, Chief Clinical Officer, Anthem, Inc.

Since 2006, the Anthem Foundation has awarded the American College of Sports Medicine (ACSM) over $1.2M as a founding partner to establish the American Fitness Index.

Seasonal shopping at your local farmers market

Eating a wide variety of colorful fruits and vegetables is the ideal way to get the necessary vitamins and minerals that your body needs. Planning meals around food that is in-season is a great way to stay healthy and keep variety in your diet!

Now that you know eating seasonally has great health benefits, how do you start planning your fresh meals? The first step is knowing where to buy ingredients. Your local farmers market is the perfect place to get seasonal produce because the sellers have likely traveled less than 50 miles from where they grow to get to the market. You can’t get fresher than that! An added bonus to shopping at your local farmers market is that you are supporting growers in your own community. This helps to build and maintain your local economy, as well as strengthen the ties of your neighborhood. Finally, many farmers markets also accept Supplemental Nutrition Assistant Program (SNAP) and Women, Infants, and Children (WIC) vouchers to make sure that fresh food is accessible to all. Not sure where the closest farmers market is located? The US Department of Agriculture (USDA) has a search tool!

The next step in planning fresh meals is knowing which produce is currently in-season in your area. This can vary depending on the climate in your hometown, but the below chart can be used as a basic reference.

seasonal produce chart

To find seasonal food in your area, use the Seasonal Food Guide.

Now it’s time to have fun and decide which foods you will eat! Try mixing in your favorites, as well as some new options to keep meals exciting and maximize your nutrient intake. Want to try a new food, but not sure the best way to prepare it? Ask the seller! As the one who has grown the food, they will be very familiar with its flavor and will be able to recommend what other foods pair well. Enjoy!

Download the above chart as a PDF. 

air quality and outdoor exercise blog post

Air Quality and Outdoor Exercise

There is incontrovertible evidence linking poor air quality to adverse health outcomes. This is especially true for people with pre-existing conditions such as heart disease, stroke, asthma and chronic obstructive pulmonary disease. However, healthy people are at risk too. Exposure to air pollution has been linked to a higher risk of developing asthma, and recent studies have identified links between air pollution and adverse pregnancy outcomes.

The American Fitness Index added air quality as an indicator of a healthy and fit city for the first time with the 2019 rankings release. The Fitness Index used the Air Quality Index (AQI) from the Environmental Protection Agency which measures major air pollutants, including particle pollution, ground level ozone, sulfur dioxide and nitrogen dioxide, and carbon monoxide. The Fitness Index’s 2019 Summary Report notes that the 100 largest cities in the U.S. average only 62 percent of the year with good air quality. That means for over a third of the year residents in these cities are breathing polluted air that is harmful to their health.

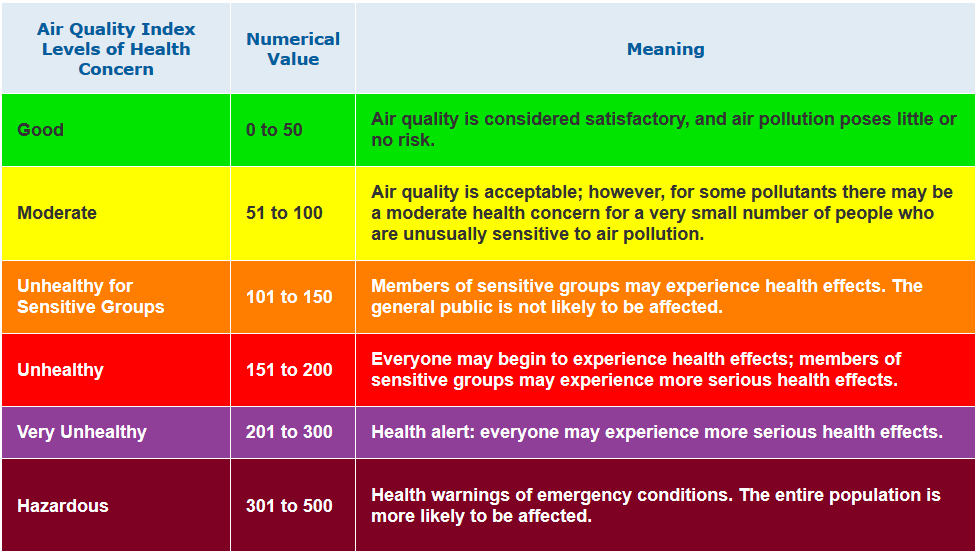
The AQI provides guidance as to the safety of the air quality. You can download the airnow.gov app for your smart phone or visit www.airnow.gov, and review the AQI for an entered zip code.

Air Quality Index Graphic
Source: Environmental Protection Agency’s Air Quality Index www.airnow.gov

Of course, we want people to be physically active, and better yet, to be active outdoors. While air pollution can affect your health, the health benefits of being physically active outweigh the risks of air pollution for most healthy individuals. However, it is important to keep in mind that an adult exercising at a moderate level of exertion exchanges about six liters of air per minute! An athlete running at 70 percent of their maximal oxygen uptake for the length of a marathon inhales the same volume of air as a sedentary person does in two days!

Tips to maintain an active lifestyle when air quality is poor:

  • Exercise earlier in the day. Both particulate pollution and ground level ozone tend to accumulate throughout the day.
  • The vast majority of air pollution comes from tailpipes – cars and trucks on the road – so avoid outdoor activity during commuting time (7:30 a.m. – 9:00 a.m., and 4:00 p.m. – 7:00 p.m.), and when possible avoid exercise next to heavily trafficked roadways.
  • Consider indoor activity opportunities like going to the gym, walking laps at the mall or working out along with an exercise video (local libraries often lend these for free).
  • It is important to note that a scarf or paper mask does not protect you from the poor air quality.

Finally, think about what you can do as an individual to reduce your contribution to poor air quality by using public transportation when possible, walking or biking to work or school, combining driving trips, eliminate idling, avoiding wood-burning and replacing or installing ultra-low nitrogen oxide water heaters. If we all do our part to clean the air, it will make the environment safer for the outdoor activities we love.

Author: Liz Joy, MD, MPH, FACSM, Intermountain Healthcare

ACSM American Fitness Index and Anthem Foundation

Partnership Between American Fitness Index and Anthem Foundation is Twelve Years Strong

The Anthem Foundation is embedded in communities across the country where it supports programs that build awareness about the importance of active lifestyles and healthy behaviors. One of the many ways we are helping to increase awareness and improve overall health is through our partnership with the American College of Sports Medicine (ACSM). Since 2006, Anthem Foundation has granted over $1.2M to ACSM as a founding partner in an effort to establish the American Fitness Index, a tool and resource for community stakeholders to address conditions in the environments that negatively affect a person’s overall health and identifies to create healthier, more active communities.

For the second year in a row, Arlington, VA received the title of ‘Fittest City’ in America in the 2019 American Fitness Index rankings. The findings of the 2019 Fitness Index are not only a great indicator of how well communities are encouraging fitness among their residents, but also reveal how social, economic and physical conditions of health within communities directly impact the health and fitness levels of America’s largest cities.

According to Healthy People 2020, a science-based initiative launched by the U.S. Department of Health and Human Services, nearly everyone is impacted by conditions in the environment that negatively affect a wide range of health, functioning, quality of life outcomes and risks in one way or another. A way to look at the health of individuals and our communities starts in our homes, schools, workplaces, neighborhoods and communities. By taking a deeper look into these areas, we can understand why some Americans are healthier than others, and focus on interactions and relations to address why other Americans are not as healthy, and come up with opportunities and solutions on how to improve the problematic areas.

Part of our ongoing strategy at the Anthem Foundation is to create meaningful partnerships with organizations, targeting specific, preventable health concerns and addressing the conditions in our environments’ social determinants that can negatively impact them. Together with the ASCM and the Fitness Index, we can continue to look toward a brighter future by providing the necessary tools and resources to benefit people of all ages and backgrounds within our communities.


Author: Stephen Friedhoff, MD, Chief Clinical Officer, Anthem, Inc.

Changes in the 2019 ACSM American Fitness Index: What Impact Will They Have?

Since the creation of the ACSM American Fitness Index®, the data team constantly looks for ways to improve the rankings. Also, as data sources change the information they gather, we must make changes in the indicators that are used. Both improvements and data source changes took effect as we prepared the 2019 Fitness Index rankings.

The data team worked closely with the experts on the Fitness Index Advisory Board to add four new measures to make the Fitness Index more complete:

  • Complete Streets policy
  • Pedestrian fatality rate
  • Bike Score®
  • Air quality index

These new indicators reflect the importance of policy and built environment in supporting active living that will lead to improved personal health outcomes. For example, cities that successfully implement Complete Streets policies can reduce pedestrian fatalities. Likewise, cities with high Bike Scores help to ensure bicyclists are safe and comfortable riding for transportation and recreation, which improves physical and mental health. While air quality is not often thought of in relation to physical activity, poor air quality has been shown to discourage physically active lifestyles, especially among people with respiratory limitations like asthma or COPD.

The data team also removed three indicators to help balance the Fitness Index and removed one indicator that no longer had a reliable data source:

  • Parkland as percentage of city
  • Acres of parkland/1,000 residents
  • Dog parks/100,000 residents
  • Percentage of residents getting 7+ hours of sleep/day

The three park-related indicators were removed to focus on the built environment characteristics that have a measurable effect on physical activity behaviors and health outcomes. The Behavior Risk Factor Surveillance System stopped regularly asking how much sleep people got on average; as a result, the sleep measure was removed from the list of indicators.

The data team also made some adjustments in the placement and weight applied to a few indicators to improve balance and consistency. Even with these changes, the 2019 Fitness Index includes the same number of indicators as were used in 2018 (33), and most of the indicators did not change.

The data team and Fitness Index Advisory Board do not make decisions about changes in the Fitness Index lightly, because cities need to know if their level of “fitness” is getting better from year to year. A lot of discussion and debate occurs among our expert advisors whenever changes are considered. The experts must be convinced that the changes follow current scientific thinking and will make the Fitness Index better; however, we also realize substantial changes cause problems when comparing rankings and scores over time.

With these changes, you might be wondering, “How do these changes impact my city’s score and ranking for 2019?” We believe that the 2019 Fitness Index is a more accurate and fair measure of your city’s fitness, which is a really good thing. However, when you compare the rankings and scores in 2019 to those reported in 2018, part of the shift may be due to the changes in the methods. For example, cities that have invested in making their streets and neighborhoods safer for walking and biking may see a better ranking in 2019 compared to last year, while cities that have larger and more parks may see a drop in the rankings due to these changes.

Advice for interpreting your city’s rank and scores for 2019

Although it is a natural inclination, please don’t compare the overall ranking and scores to those of previous years. Part of the change in rankings could be due to the updates that were made this year. Instead, look at where your city falls generally in relation to the other cities on the list. Is your city in the top 25, in the bottom 25 or somewhere in the middle?

What you also can and should do, is compare your city’s individual indicators from 2018 to 2019 to see which ones improved. After all, the goal of the Fitness Index is to see if your city’s residents are getting healthier and if there have been improvements in your city’s infrastructure to encourage healthy behaviors.

As always, our team here at the American College of Sports Medicine supports and applauds your efforts to become more fit and healthy! We believe the 2019 Fitness Index rankings can help inform decisions that will make your city and its residents healthier.

The 2019 American Fitness Index rankings will be released on May 14, 2019. 

Sign up to get exclusive insights into the report on the day of the release.


Author: Terrell W. Zollinger, Dr.P.H, MSPH

From 50 to 100: Lessons Learned from the Expansion of the American Fitness Index

Two criticisms of the first decade of the ACSM American Fitness Index®and its annual report were that it was limited to only the 50 most populated cities in the USA and that the entire metropolitan area was counted among the data. These two observations had some merit. Cities protested that a certain suburb was not really a suburb (but based on the federal government definition of Metropolitan Statistical Area it was) and smaller cities like Arlington, Virginia and Madison, Wisconsin said “what about me?” The original approach to the rankings provided important and valuable general messages but limited the ability to provide targeted assistance to city and community leaders.

That all changed when the 2018 Fitness Index was released. The number of cities reported on grew to the top 100 largest cities based on population, and the definition of “city” was limited to the city limits. The updated approach provides city leaders with the local data that they need to make changes. The data are more in line with governing structures within a city and acknowledge the differences in health behaviors and community-level infrastructure between the city and surrounding suburban areas. The expanded rankings also provide a more inclusive approach by adding cities in states that weren’t previously represented.

With this new definition of city and the inclusion of the top 100, there are still opportunities for the Fitness Index to consider with future updates. For example, in my own hometown of Atlanta (ranked #20 in 2018), the reported population is 473,000 although there are three times that number working within the city limits each day (don’t try driving a car during rush hour!).

Some people might say that the Fitness Index should include the “near” suburbs. This idea may have merit, but the Fitness Index faces challenges with every update. For example, there is not a standardized approach for defining “near” suburbs. Absent of any way to standardize that approach for all cities (and to make fair comparisons), the definition of city was established for the 2018 report. Additionally, changes made to the Fitness Index must have reliable, regularly updated data sources. Currently there are limited data sets that include “near” suburbs.

The methodology for the 2019 rankings remains the same as was used in 2018. There are still 33 indicators divided almost equally between personal health indicators (health behaviors and health outcomes) and community/environmental indicators (built environment, recreational facilities, policy and funding). The city definition has not changed since 2018.

Effect on the rankings

Interestingly, while direct comparisons cannot be made between rankings for MSAs and the city proper, the 2018 rankings found that most cities ranked similar to their MSA ranking from 2017. The 2018 rankings indicate that for MSAs ranked high in the 2017 Fitness Index, the central cities of those MSAs also ranked high in the 2018 rankings. The 2017 rankings for MSAs in #1 Minneapolis, #2 Washington, D.C. and #3 San Francisco remained highly ranked after the 2018 expansion.

A similar pattern appeared in low ranking MSAs and their central cities. The cities ranked toward the bottom of the 2017 Fitness Index when 50 MSAs were reported included #48 Indianapolis, #49 Oklahoma City and #50 Louisville. In 2018, these cities remained among the lowest ranked cities (#98 Louisville, #99 Indianapolis and #100 Oklahoma City). Although these cities continue to be ranked the lowest among the top 100 most populated cities in the USA, there are some grassroots programs starting to take hold and some success has been achieved.


Author: Walt Thompson, Ph.D., FACSM

American Fitness Index: 10+ Years of Improving Community Health

The American College of Sports Medicine launched the American Fitness Index (Fitness Index) in 2008. The Fitness Index ranks the 100 largest cities in the United States according to variables that reflect and affect physical activity, physical fitness, health and quality of life of community members. Public health databases serve to develop the Fitness Index and include such components as: percent of adults exercising in the last 30 days, percent with obesity, percent who live within 10 minutes of a park and percent walking or biking to work. The Fitness Index provides information to civic and public health leaders regarding the “health” of their city and citizens and serves as a baseline or benchmark for cities to aspire and measure progress.

When it comes to changing health behaviors and health outcomes, those efforts that influence policy and environment are the most important levers to pull (think Clean Indoor Air Act). Since implementation of tobacco legislation, we’ve seen the rate of tobacco use decrease by about half, from 30+ percent of adults, to 14 percent of adults. Not surprisingly, the decrease in tobacco use in the United States is paralleled by an observed decrease in cardiovascular disease 507 deaths/100,000 to 273 deaths/100,000 people.

Physical activity and resultant physical fitness have a profound influence on health. The recently released 2018 Physical Activity Guidelines for Americans highlight the importance and influence of regular physical activity on health. To have the greatest impact, efforts that aim to promote physical activity in communities should address policy and environment, for example: school physical education requirements, bicycle lanes, public transportation infrastructure and farmers’ markets.

As a result of the Fitness Index, several cities have undergone significant efforts to address community infrastructure and policy with remarkable results!

Let’s take Oklahoma City for example. Under the leadership of their mayor, Mick Cornett, the city collectively lost one million pounds! They made the following changes to achieve these phenomenal outcomes: installed 400 miles of new sidewalks, over 100 miles of new jogging and biking trails, built a downtown park, built all new gyms in all the inner-city grade schools and removed fried foods from the school lunchroom.

We’ve watched other cities make meaningful improvements in their communities and in the health of their populations. It is important to continue these gains in cities, towns and communities across the country. We spend nearly 18 percent of our GDP (gross domestic product) on healthcare. These costs are largely driven by chronic diseases such as type 2 diabetes, which is most often related to unhealthy diet, insufficient physical activity and subsequent obesity.

Now more than ever, we need the American Fitness Index to help raise awareness and motivate, nudge, maybe even jolt community leaders to address infrastructure, environment and policy that allow community members to live their healthiest lives possible.

Author: Elizabeth Joy, MD, MPH, FACSM

Five Frequently Asked Questions About the Physical Activity Guidelines for Americans, 2nd Edition

In 2008, the US Department of Health and Human Services (DHHS) issued the federal government’s first-ever Physical Activity Guidelines for Americans (Guidelines) to help Americans understand the types and amounts of physical activity that offer important health benefits. Given the extensive amount of new information available over the past decade, DHHS released the second edition of the Physical Activity Guidelines for Americans on November 12, 2018.


#1 How many Americans meet the Physical Activity Guidelines?

In 2017, only about 20% of high school students and 25% of adults reported getting enough physical activity to meet the aerobic and muscle-strengthening guidelines.


#2 How much physical activity do school-aged youth and adults need?

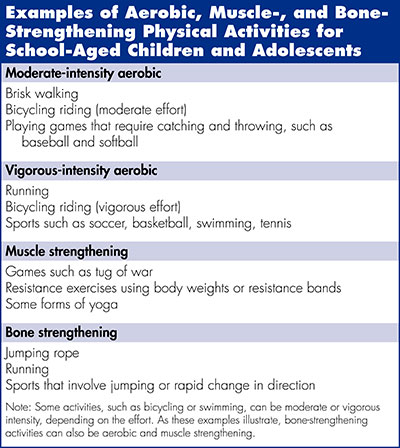
The guidelines for children and adolescents are as follows:

  • It is important to provide young people opportunities and encouragement to participate in physical activities that are appropriate for their age, that are enjoyable and that offer variety.
  • Children and adolescents aged six through 17 years should do 60 minutes or more of moderate-to-vigorous physical activity daily:
    • Aerobic: Most of the 60 minutes or more per day should be either moderate- or vigorous-intensity aerobic physical activity and should include vigorous-intensity physical activity on at least three days a week.
    • Muscle-strengthening: As part of their 60 minutes or more of daily physical activity, children and adolescents should include muscle-strengthening physical activity on at least three days a week.
    • Bone-strengthening: As part of their 60 minutes or more of daily physical activity, children and adolescents should include bone-strengthening physical activity on at least three days a week.

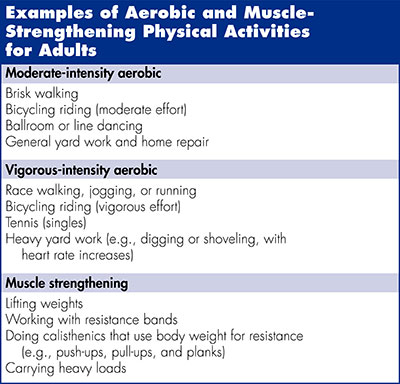
The guidelines for adults are as follows:

  • Adults should move more and sit less throughout the day. Some physical activity is better than none. Adults who sit less and do any amount of moderate-to-vigorous physical activity gain some health benefits.
  • For substantial health benefits, adults should do at least 150 minutes to 300 minutes a week of moderate-intensity, or 75 minutes to 150 minutes a week of vigorous-intensity aerobic physical activity, or an equivalent combination of moderate- and vigorous-intensity aerobic activity. Preferably, aerobic activity should be spread throughout the week.
  • Additional health benefits are gained by engaging in physical activity beyond the equivalent of 300 minutes of moderate-intensity physical activity a week.
  • Adults should also do muscle-strengthening activities of moderate or greater intensity and that involve all major muscle groups on two or more days a week, as these activities provide additional health benefits.

See Physical Activity Guidelines for Americans, 2nd Edition for additional key guidelines for the following populations:

  • Preschool-aged children.
  • Older adults.
  • Women during pregnancy and the postpartum period.
  • Adults with chronic health conditions and adults with disabilities.
  • Safe physical activity.


#3 To meet the current Physical Activity Guidelines, do Americans need to be more or less active compared to what was first recommended in 2008?

The new evidence reinforces the amounts and types of physical activity recommended for youth and adults in the 2008 Guidelines. The total amount of physical activity didn’t change in the second edition of the Guidelines. However, unlike the 2008 Guidelines, with the current Guidelines, moderate- and vigorous-intensity physical activity no longer needs to occur in bouts of at least 10 minutes to count towards meeting the adult aerobic activity guideline.


#4 What has changed in this second edition of the Guidelines?

This second edition of the Guidelines reflects the extensive amount of new knowledge gained since the 2008 release of the first edition of the Guidelines. This second edition of the Guidelines discusses the proven benefits of physical activity and outlines the amounts and types of physical activity recommended for different ages and populations. For example, new aspects include discussions of:

  • Immediate and longer-term benefits for how people feel, function and sleep after being physically active.
  • Additional health benefits of physical activity related to brain health, additional cancer sites and fall-related injuries.
  • Further benefits of being active among older adults and people with additional chronic conditions.
  • Risks of sedentary behavior and their relationship with physical activity.
  • Guidance on activity levels for preschool children aged three through five years.
  • Elimination of the requirement for physical activity of adults to occur in bouts of at least 10 minutes.
  • Tested strategies that can be used to get the population more active.


#5 Where can I find more information?

Learn more about the latest Physical Activity Guidelines for Americans. You can also explore the Move Your Way for interactive tools (like the one below), motivational videos, and helpful tips to make it easier to move more and sit less. Remember, physical activity can make you feel better right away including:

  • Boosting your mood,
  • Sharpening your focus,
  • Reducing your stress, and
  • Improving your sleep.

Author: Kathleen B. Watson, Ph.D. 

2018 Physical Activity Guidelines – How to Meet the Goals in Everyday Activities

The other day I heard a story about a woman who hated to exercise. She wanted nothing of it: going to the gym, sweating, walking on the treadmill. Boring. No way! She’d heard about the latest 2018 U.S. Physical Activity Guidelines, but had dismissed them as irrelevant to her life.

Recently, she stumbled onto an article that said the activities she was doing in everyday life counted as exercise and that moving more could actually make her feel better. “Cleaning the house, sweeping the porch, mowing the lawn, and walking my child to school are exercise? Really? I need to learn more!”

Off she went to search the internet. She discovered the Compendium of Physical Activities that listed MET values for hundreds of activities. METs? What are those? After learning that METs are a multiple of energy expended at rest (1 MET), the woman got a paper and pen and went to work. She listed all of her daily activities and how much time she did them each week. Then she separated the activities into light-, moderate-, and vigorous-intensity categories based on the MET values. Low and behold, she spent a lot of time in moderate activities and even some in vigorous activities. Amazing!

She wondered, how many minutes are ‘enough’? She remembered the 2018 U.S. Physical Activity Guidelines and went back to the internet. The guidelines recommended that she should “move more and sit less throughout the day.” Check! She did that.

The guidelines also recommended that she also “do at least 150 – 300 minutes of moderate-intensity activities (3.0-5.9 METs) or 75 minutes of vigorous-intensity activities (6.0 and higher METs), or a combination of the two intensities each week. Preferably the activities should be aerobic. And every minute counted.” Based on her list of activities and METs, she was close to meeting that goal too. She was on a roll!

The third guideline stopped her in her tracks. They recommended she “do at least two days of muscle-strengthening activities of moderate or greater intensity that involve all her major muscle groups.” Whoa. She didn’t do any muscle strengthening activities. She had no idea what were her major muscle groups.

Back to the internet for more information.

The woman learned that it’s important to work the major muscle groups: the chest, shoulders, back, biceps and triceps, legs and calves, and stomach. Oh. No way she worked these muscle groups at least two days a week, let alone one day a week.

To get help with where to start, the woman went to a nearby gym and worked with a trainer who showed her exercises to strengthen her muscles. She added these exercises to her schedule twice a week and, she liked it! She was getting stronger, her body was firming up and she liked how she felt during and after her workouts. She was sweating and loving it!

Before she knew it, the woman was looking for ways to get moving intentionally. She dusted off that old bicycle in the garage and took it for a spin. She bought a fitness tracker and took the long way to pick up her child at school. She even signed up for an exercise class to get more minutes of vigorous-intensity activities. Moving more had become a part of her life. Everything she was doing, even the bite-sized amounts of activity, counted toward her activity goals. She felt great, slept better, and had more energy.

The moral to this story is that if we move every day, we are doing positive things for our mental and physical health. The new 2018 U.S. Physical Activity Guidelines tell us how much activity we need on a regular basis to improve our health and reduce our risk of chronic diseases. So here’s to an active and healthy 2019 as we aim for every child, adult and senior to reach the goals set in the 2018 U.S. Physical Activity Guidelines.


Author: Barbara E. Ainsworth